In the months (and years) following 9/11, airline travel was fundamentally altered. Despite a host of new measures to increase safety, not until April 2004 did airlines see passenger loads reach pre-9/11 levels. When thinking about how that crisis compares to the current pandemic, current and former airline execs say the current pandemic is having a much more significant impact on travel than 9/11 did. On the prospect of when travel could return to pre-COVID levels, a former CEO of American Airlines, Robert Crandall, flatly predicted in the Wall Street Journal that "you are never going to see the volume of business travel that you've seen in the past."
And official statistics confirm this notion. The U.S. Bureau of Transportation Statistics' index for passenger travel (shown in chart 1) registered a roughly 20 percent drop around September 2001, while as of April (the most recent month of data), passenger travel fell off a cliff. The raw index level was 10, which means that passenger transportation across all modes fell to 10 percent of its average level during 2000—two decades ago.
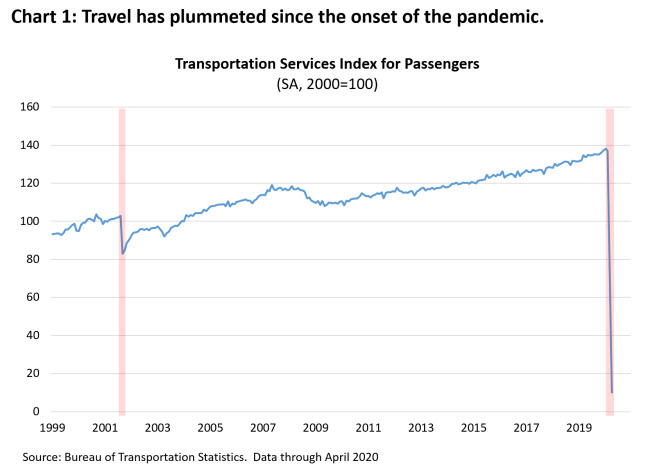
Although higher-frequency data point to a modest rebound in travel since bottoming out in April, the travel numbers at airports are now only about 70 percent below last year's levels (as opposed to down 95 percent in early April). But that hasn't kept many folks from wondering what the future of air travel will look like or how long it will take until people are once again comfortable enough to starting flying for work or leisure.
As we've highlighted during the past couple of months, the coronavirus pandemic has had a profound impact on job reallocation, firms' expectations for employees working from home after the pandemic, and reconsideration of firms' future office space needs. This post also discusses possible coming changes. Results from our most recent Survey of Business Uncertainty (SBU) suggest that firms anticipate slashing their postpandemic travel budgets and tripling the share of external meetings (those with external clients, patients, suppliers, and customers) conducted virtually.
In our latest SBU—which was in the field July 13–24—we asked business decision makers to describe how, relative to 2019 (see chart 2), their travel budgets are likely to change after the pandemic is over and whether the postpandemic share of external meetings conducted virtually will change. (You can read more about the SBU here.)
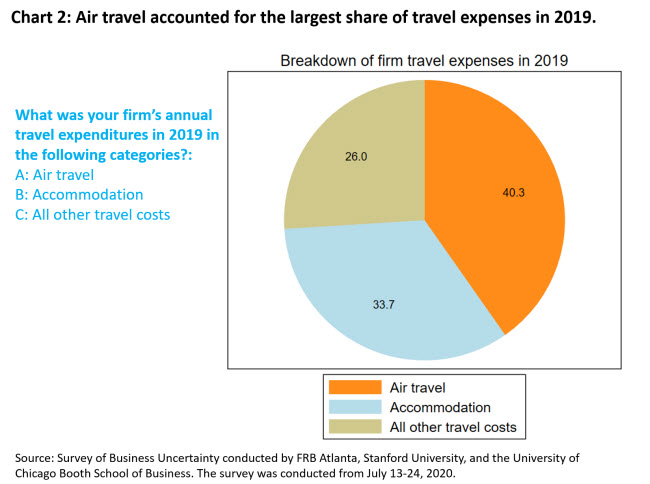
Chart 2 indicates that air travel accounted for roughly 40 percent of 2019 travel expenses for most broad industries, with the remainder split between accommodation and all other travel costs. And, as you may have expected, industries such as business services, information, finance, and insurance accounted for an outsize share of overall travel spending (42 percent of all travel spending in our data).
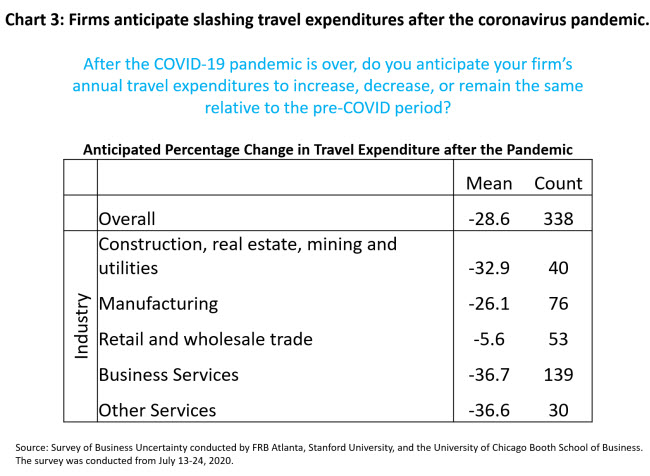
As chart 1 clearly indicates, the pandemic has led many firms to halt or severely curtail travel, but the important question is whether business travel recovers fully following the pandemic. Unfortunately, for the transportation and travel industries, our results cast doubt on the prospect for a quick and complete rebound in business travel. Firms anticipate slashing their annual travel expenditures by nearly 30 percent when concerns over the virus subside (see chart 3). The expected decline in travel expenditures is particularly severe for information, finance, insurance, and professional and business services. Firms in these industries are marking in a nearly 40 percent reduction in travel spending after the pandemic is over. Overall, these results paint a fairly pessimistic view going forward.
Firms in our survey are not alone in their pessimism. A recent forecast from the International Air Transport Association projects air travel will remain below its prepandemic trend through 2024.
Such a large, broad-based reduction in travel spending not only suggests a sluggish and potentially drawn-out recovery for the travel, accommodation, and transportation industries, but it also indicates that firms expect to shift from face-to-face meetings to lower-cost virtual meetings. And, as chart 4 shows, that's exactly what we found when we asked firms about the share of virtual meetings they held in 2019 versus the share they anticipate holding in a post-COVID world.
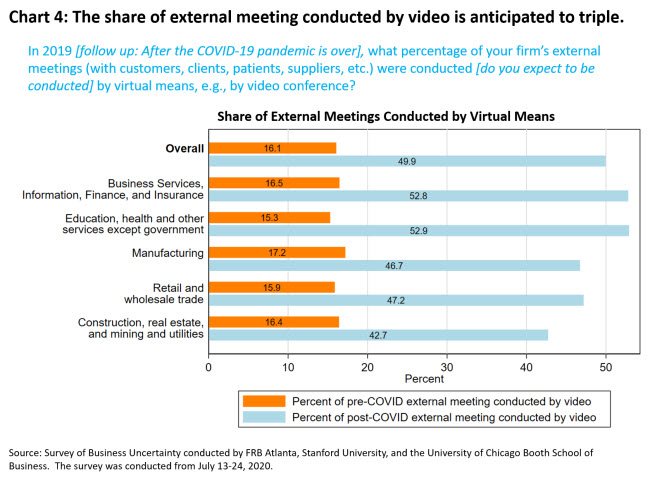
After the pandemic ends, firms anticipate conducting roughly half of all meetings with external clients, customers, patients, and suppliers by videoconference. Said another way, they expect the share of virtual meetings to triple relative to prepandemic averages.
The coronavirus pandemic is reshaping the economic landscape in myriad ways. Business travel appears to be front and center in this transformation, as firms anticipate slashing travel expenses by a quarter and tripling the share of external meetings conducted virtually.
Move over, jet lag—here comes "Zoom" fatigue.
Authors' notes on this post's charts:
- Chart 1: The passenger transportation index consists of: 1) local mass transit, 2) intercity passenger rail, and 3) passenger air transportation. It does not include intercity bus, sightseeing services, ferry services, taxi service, private automobile usage, or bicycling and other nonmotorized means of transportation.
- Chart 2: The survey was conducted July 13–24, 2020. In computing the data, each firm is weighted by its employment, and industries are further weighted to match the one-digit distribution of payroll employment in the U.S. economy.
- Chart 3: The survey was conducted July 13-24, 2020. These data have been weighted using the same procedure as in chart 2 and have been winsorized at the 1st and 99th percentile to remove the influence of outliers. For firms overall, the 95 percent confidence interval for the anticipated percentage change in travel expenditures is -33.4 percent to -23.8 percent. "Business Services" includes information services, finance and insurance, and professional and business services. "Other Services" includes educational services, health care and social assistance services, leisure and hospitality, as well as other services except government.
- Chart 4: The survey was conducted July 13–24, 2020. "External meetings" indicates those involving customers, clients, patients, suppliers, etc. These data have been weighted using the same procedure as in chart 2.
 By David Altig, executive vice president and research director in the Atlanta Fed's Research Department,
 Jose Maria Barrero, assistant professor of finance at Instituto Tecnológico Autónomo de México Business School,
 Nick Bloom, the William D. Eberle Professor of Economics at Stanford University,
 Steven J. Davis, the William H. Abbott Professor of International Business and Economics at the Chicago Booth School of Business and a senior fellow at the Hoover Institution,
 Brent Meyer, a policy adviser and economist in the Atlanta Fed's Research Department,
 Emil Mihaylov, research analyst in the Atlanta Fed's Research Department, and