In September 2016 we introduced the Taylor Rule Utility, a tool that allows a user to plot the federal funds rate against the prescription from an equation called the Taylor rule, shown below:
Broadly speaking, the Taylor rule translates readings of inflation (πt) and resource slack (gapt)—often measured by comparing real gross domestic product (GDP) or the unemployment rate to some measure of its "potential" or "natural" level—into a recommended setting for the fed funds rate. The default settings of the rule as of September 2016 (incorporated in the blue dashed line in the chart below) were, apart from some minor differences in variable choices, consistent with the settings used in John Taylor’s landmark 1993 paper that introduced the Taylor rule.
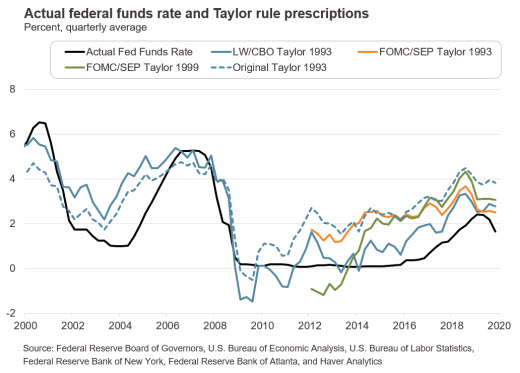
As the chart shows, for most of this decade, the funds rate prescription from this original Taylor rule consistently exceeded the actual rate by 1 to 3 percentage points, and as Wall Street Journal columnist Michael Derby noted last August, the prescription was well above the actual funds rate in the third quarter of 2019. Much of this difference can be explained by the setting of the natural (real) interest rate, or r*, in the above equation. Taylor set r* at 2 percent in his original rule based on average real GDP growth since 1984 and, according to estimates from the Laubach-Williams (LW) model, 2 percent continued to be a reasonable, if slightly low, estimate of r* up until the 2007–09 recession. Since 2009, estimates of r* from the LW model have generally hovered between 0 and 1 percentage point. Since July 2017, the semiannual Monetary Policy Report from the Board of Governors to Congress has included a section on monetary policy rules. And in these sections, r* has been estimated with the consensus long-run projection of a short-term interest rate from Blue Chip Economic Indicators. Since 2015, these Blue Chip interest rate projections have also been consistent with estimates of r* between 0 and 1 percent.
Setting r* to the LW model estimate (instead of 2 percent) in the Taylor rule results in a prescription corresponding to the solid blue line in the above chart. We can see this line is much closer to the actual fed funds rate for most of this decade. Nevertheless, it’s not clear that rules using LW-model estimates of r* and Congressional Budget Office (CBO) estimates of potential GDP or the natural unemployment rate are the most relevant for monetary policymakers. For example, in the December 2019 Summary of Economic Projections (SEP), the central tendency of Federal Open Market Committee (FOMC) participants’ longer-run projections of the unemployment rate was 3.9 to 4.3 percent. Conversely, the CBO’s latest estimate of the natural unemployment rate in the fourth quarter of 2019 rounds up to 4.6 percent, while its latest estimate of the natural rate in 2025 rounds up to 4.5 percent. The orange line in the chart above uses the FOMC/SEP longer-run projections of the fed funds rate and the unemployment rate.
Both the LW/CBO and FOMC/SEP variants of the Taylor 1993 rule prescribed an earlier "liftoff" of the fed funds rate than actually occurred. Former Fed chairs Ben Bernanke and Janet Yellen have sometimes referred to an alternative rule known as Taylor 1999. The FOMC/SEP Taylor 1999 rule, which puts twice as much weight on the resource gap as the FOMC/SEP Taylor 1993 rule, is the green line in the above chart that is identical to the orange line apart from a doubling of the resource gap coefficient in the above equation. This rule prescribed a later liftoff date than the other rules depicted in the chart. Because of the low unemployment rate, its current funds rate prescription is now above the rate that the FOMC/SEP 1993 rule prescribes.
By now, it’s probably clear that the answer to the question I posed in this blog post’s title is no, there is not a Taylor rule for all seasons—or at least not one that would satisfy everybody. For this reason, we have modified the interactive chart in our Taylor Rule Utility to show prescriptions from up to three versions of the Taylor rule. The default settings of these three rules in the interactive chart coincide exactly with the solid blue, orange, and green lines in the above figure. But you can modify all of the rules to generate, for example, the dashed blue Taylor 1993 line shown above. We hope that users find this a useful enhancement to the tool.
 By Pat Higgins, a policy adviser and economist in the Atlanta Fed's research department