Editor's note: In December, Real Estate Research will become part of the Atlanta Fed's Policy Hub publication.
"If you can get the right tool targeted and aimed at the right problem, you can solve that problem and make a lot of progress."
- Raphael Bostic, Atlanta Fed President, during Racism and the Economywebinar (around the 1 hour, 58 minute timestamp) on October 7, 2020
Many cities have begun their efforts to combat COVID-19-related housing effects on renters by estimating the number of affected households, claiming federal CARES Act relief funds, and distributing the funds to households in need through local organizations. More than likely, the number of vulnerable households will exceed the funds that have been made available to assist them. In this post, we continue our data exploration of households that are likely to be vulnerable to housing insecurity as a result of COVID-19.
Picking up where we left off in our July 13 blog post, we focus exclusively on renter households and explore regional variations in the estimated impacts to renters susceptible to COVID-19-related job loss across the Atlanta Fed's territory, the Sixth District, which covers much of the southeastern United States (Alabama, Florida, Georgia, and portions of Louisiana, Mississippi, and Tennessee). As we did for our national-level analysis, we adopt New York University's Furman Center methodology1 and we focus on the intersection of income, cost-burdened status, dwelling unit type, and race in an effort to better understand the distributional impact across renter households. The estimates we provide here can be used to highlight opportunities for targeted local responses. Localities can also use these estimates to assess whether, and how well, their disbursed funds are reaching those most in need. Further, this analysis can help policymakers and local leaders anticipate the gap between their pool of existing resources and the level of support they may ultimately need, given the estimated size and spread of renter household vulnerability. In short, we hope this work can help localities sharpen their tools and better identify their problems as they work to combat rental housing insecurity resulting from COVID-19.
Sixth District regional trends
We took a combined look at nine metropolitan statistical areas (MSAs) across the Sixth District: Atlanta, Georgia; Bay County, Florida; Birmingham, Alabama; Gulfport, Mississippi; Jacksonville, Florida; Miami, Florida; Nashville, Tennessee; New Orleans, Louisiana; and Orlando, Florida. We estimate there to be nearly 1.05 million renter households (or 16.9 percent of all renter households in the nine MSAs) that may be vulnerable to job loss tied to the COVID-19 pandemic. Using microdata from the Census Bureau's 2018 American Community Survey (ACS) provided by IPUMS USA, University of Minnesota![]() ,2 we estimate that:
,2 we estimate that:
- More than half of vulnerable renter households had incomes less than $50,000 (593,202, or 56.9 percent).
- Going into the pandemic, slightly more than half of vulnerable renter households (532,231, or 51 percent) were cost-burdened—that is, they were spending more than 30 percent of their income on housing costs.
- Looking deeper into the cross-section of income and housing-cost burden, a whopping 87.6 percent of cost-burdened renter households vulnerable to COVID-19-related job loss earned less than $50,000.
Targeting aid to cost-burdened households earning less than $50,000 could be important because these households face steeper challenges than others in maintaining emergency savings. In fact, according to data from the Federal Reserve's 2019 Survey of Household Economics and Decisionmaking![]() , households earning under $50,000 are less likely to have a three-month rainy-day fund than households who earn more than $50,000, making it more difficult for this demographic to weather such a shock to their income as reduced work hours, temporary furlough, or job loss.
, households earning under $50,000 are less likely to have a three-month rainy-day fund than households who earn more than $50,000, making it more difficult for this demographic to weather such a shock to their income as reduced work hours, temporary furlough, or job loss.
We also estimate that an overwhelming majority of renter households vulnerable to COVID-19-related job loss (902,656, or 86.7 percent) either lived in single-family rentals (392,978) or rentals in buildings with fewer than 50 units (509,678).
By ensuring that aid is directed to renter households residing in single-family houses, small multifamily buildings (two to four units), or medium multifamily buildings (five to 49 units), rental relief efforts are more likely to reach smaller-scale landlords as opposed to institutional landlords. Smaller landlords are more likely to operate on thinner margins, leaving them unable to offset an extended period of time when they can't collect rents. If these smaller-scale landlords fail, the stock of housing they provide—housing that tends to be more affordable3 and supports an overwhelming majority of renter households—could change hands and displace many lower-income tenants as a result.
And finally, we estimate that:
- Over two-thirds of vulnerable renter households (703,896, or 67.5 percent) self-identify as a race other than non-Hispanic white.4
- Nearly three-fourths of cost-burdened renter households vulnerable to job loss were categorized as a race other than non-Hispanic white (390,154, or 73 percent).
Acknowledging the disproportionate impact of COVID-19 related job loss on renter households of color and targeting aid towards these households could help to prevent any exacerbation of existing racial disparities.
Metro-level trends
While summary statistics at the regional level provide a helpful reference point, we also drill down further because policy responses such as emergency rent relief and eviction moratoria5 are much more likely to be implemented at the local level. The first animated GIF below presents estimates of vulnerable renter households by income, cost-burden status, and dwelling unit type.6
A few additional observations emerge beyond what we've cited at the regional level.
First, although the majority of renter households susceptible to job loss earn less than $50,000, metros with more than 450,000 people (specifically Atlanta, Miami, Nashville, and Orlando) tend to have vulnerable households across a broader income distribution. Put differently, in larger metro areas, renter households can have slightly higher incomes and still experience housing vulnerability.
Second, as we cited in the regional trends above, vulnerable renters are most likely to reside in single-family units or multifamily buildings with fewer than 50 units. It could be argued, though, that this is to be expected given that most renters in any metropolitan area live in single-family homes or small- to medium-sized multifamily buildings. We applied a chi-squared test to understand whether vulnerable renters were statistically more likely than other renters to reside in buildings with fewer than 50 units and found that, indeed, there was a statistical difference for all of the metropolitan areas we examined except for Jacksonville.
Third, Miami (59.5 percent), New Orleans (56.7 percent), and Orlando (51.8 percent) had shares of cost-burdened and vulnerable renters above 50 percent, which stood out as elevated relative to the other metropolitan areas we examined.
Finally, given the well-documented disproportionate impact that COVID-19 is having on people of color![]() , we take our regional-level analysis one step further than our national-level analysis and substitute a racial lens (white versus nonwhite)7 for the cost-burdened lens in an effort to analyze the distributional impacts of COVID-19-related job loss by renter household race. The second animated GIF, below, presents estimates of vulnerable renter households by income, race, and dwelling unit type.
, we take our regional-level analysis one step further than our national-level analysis and substitute a racial lens (white versus nonwhite)7 for the cost-burdened lens in an effort to analyze the distributional impacts of COVID-19-related job loss by renter household race. The second animated GIF, below, presents estimates of vulnerable renter households by income, race, and dwelling unit type.
As the charts demonstrate, the distribution of race across income and dwelling unit type varies by metropolitan area. To better assess whether or not there might be disparate exposure to COVID-19 housing vulnerability across race, we compare the race of vulnerable renter versus the race of all renter households for each metropolitan area (see the table).
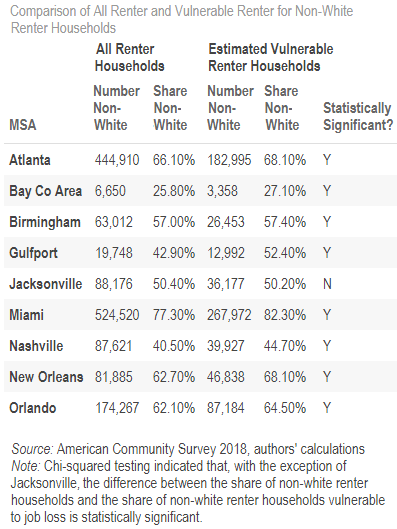
While each metropolitan area's share of renter households of color appears to be similar to the shares of estimated vulnerable renter households identifying as races other than non-Hispanic white, a chi-squared test revealed that the two shares are in fact statistically different for all of the metropolitan areas except Jacksonville.8 In other words, our analysis is consistent with the idea that the pandemic may be causing a disproportionate hardship on households of color. As a result, failure to respond with targeted policy interventions for vulnerable renter households is likely to have an outsized impact on households of color. Localities may be well-served to carefully consider race as they design and evaluate their programs that support vulnerable renters to ensure that they aren't inadvertently exacerbating existing racial disparities.
Taken together, the intersection of these metrics can help localities better understand the scale of the COVID-19-related rental vulnerabilities in their communities, particularly as those vulnerabilities may exacerbate existing inequities along racial lines. We hope that this analysis, which highlights the greatest housing vulnerabilities in communities across the Southeast, provides policymakers and leaders on every level with insights that will help them respond to the ongoing COVID-19 pandemic and emerge with an inclusive recovery plan. In that process, the estimates provided above can be used as a planning and advocacy tool, as well as a benchmark to help evaluate how needs have been met.

By Jessica Dill, director of the Center for Housing & Policy,

Sarah Stein, community and economic development adviser on the community and economic development team,

Carl Hudson, associate policy adviser and economist in the Research Department, and

Nisha Sutaria, community and economic development research analyst II on the community and economic development team, all at the Atlanta Fed
Technical Notes
1 [back] The methodology![]() we used was developed by New York University's Furman Center at the onset of the COVID-19 pandemic. It incorporated all occupations that may have been vulnerable to job loss at the time. We have not updated their methodology to consider the current work status of each occupation. Therefore, these estimates likely overcount affected households and therefore should be treated as a ceiling for the estimated number of vulnerable households.
we used was developed by New York University's Furman Center at the onset of the COVID-19 pandemic. It incorporated all occupations that may have been vulnerable to job loss at the time. We have not updated their methodology to consider the current work status of each occupation. Therefore, these estimates likely overcount affected households and therefore should be treated as a ceiling for the estimated number of vulnerable households.
2 [back]
To look at the intersection of income, cost-burdened status, dwelling type, and race, we use microdata from the Census Bureau's 2018 American Community Survey, as provided by IPUMS USA, University of Minnesota![]() . Census microdata are not (necessarily) available down to the city level, to protect the anonymity of respondents, so all analysis above was conducted at the metropolitan-level using aggregated PUMA, or Public Use Microdata Areas
. Census microdata are not (necessarily) available down to the city level, to protect the anonymity of respondents, so all analysis above was conducted at the metropolitan-level using aggregated PUMA, or Public Use Microdata Areas![]() , data.
, data.
3 [back]
B. Y. An, R. W. Bostic, A. Jakabovics, A. Orlando, and S. Rodnyansky, "Why Are Small and Medium Multifamily Properties So Inexpensive?![]() " Journal of Real Estate Finance and Economics (2019).
" Journal of Real Estate Finance and Economics (2019).
4 [back]
The ACS categorizes Hispanic/Latino/Spanish as an ethnicity and not a race. For the purpose of this analysis, we group Hispanic/Latino/Spanish identification with other nonwhite racial responses in an effort to track inequality between exclusively self-reporting white respondents and all other respondents. See H. V. Strmic-Pawl, B. A. Jackson, and S. Garner, "Race Counts: Racial and Ethnic Data on the U.S. Census and the Implications for Tracking Inequality![]() ," Sociology of Race and Ethnicity, 2018, Vol 4(I) 1–13.
," Sociology of Race and Ethnicity, 2018, Vol 4(I) 1–13.
5 [back]
That latest status of eviction moratoria is being tracked by Princeton University's Eviction Lab (here) and the National Low-Income Housing Coalition (here![]() ). An overview of properties covered by the CARES ACT eviction moratorium can be found here.
). An overview of properties covered by the CARES ACT eviction moratorium can be found here.
6 [back] The data behind the animated GIFs, as well as an interactive tool presenting this same data, can be found here. In addition to selecting the metropolitan area of interest, the web tool gives the user the ability to filter the metropolitan-level household estimates by a more granular breakdown of race.
7 [back] As outlined in a previous footnote, we refer to all households coded by the 2018 American Community Survey as non-Hispanic white as "white." We refer to all households coded as anything other than non-Hispanic white as "nonwhite" or "households of color." Nonwhite and households of color include those households who identify as Hispanic.
8 [back] As we mention in footnote 4, we group households who identify as Hispanic/Latino/Spanish with nonwhite racial responses. As a robustness check, we recoded and reran our racial analysis a second time, shifting households who identified as Hispanic and white from the nonwhite category to the white category. Interestingly, this change in categorization does matter, as reflected by the different results. A chi-squared test revealed that the share of vulnerable nonwhite renter households is statistically different from the overall share of nonwhite renter households for all of the metropolitan areas we examined except Bay County and Nashville.