Notes from the Vault
Claire Greene and Oz Shy
March 2020
The United States is a land of many firsts: first flight in an airplane (1903). First person on the moon (1969). First email sent (1971). First nation to go fully paperless for payments? Not so likely.
Developments in Sweden, China, and Canada have revived predictions that fully paperless payments are just around the corner. These three countries are considering introducing central bank digital currency to replace (or partially replace) physical notes and coins. In the United States, pundits have been predicting a cashless retail environment since the mid-1970s; for example, in 1978 Massachusetts banned retailers from refusing to accept cash as payment. During 2017 and 2018, U.S. consumers made 29 percent of their payments with cash.
Paper checks are also rare around the globe, for example, they are rare in Canada, Germany, Austria, and the Netherlands.1 Historically, unlike the United States, the payment system in most northern European countries relied on a very small use or even no use of paper checks. This is because of the early development of the Giro system provided by the post office in these countries. While paper check use has fallen precipitously in the United States since the beginning of the 21st century, U.S. consumers still made 7 percent of their payments with paper checks in 2017 and 2018.
In this Note from the Vault post, we'll take a look at preferences for the use of paper checks, who uses checks, who uses cash, and in what situations. Our findings show the resilience of these old-fashioned paper payment instruments.
Who prefers to pay via paper check?
Over the last decade, the Survey of Consumer Payment Choice has reported a decline in the number and percentage shares of consumer payments using paper checks. In 2009, U.S. consumers age 18 and older made 13 percent of their payments with checks; in 2018, the figure was 5 percent. In addition, more consumers do not use checks at all. In 2009, 13 percent of consumers reported they did not use a paper check even once during the year. In 2018, 39 percent of consumers reported that they did not use a paper check even once.
Nevertheless, in a review of 22,967 payments that a representative sample of U.S. consumers made in 2017 and 2018, checks exhibit surprising resilience. Consumers used checks for 7 percent of transactions overall in 2017 and 2018: 1,600 payments in this sample. The average consumer wrote three checks per month.
The data are taken from the 2017 and 2018 Diaries of Consumer Payment Choice (DCPC).2 For this diary survey, respondents record, either in real time or by the end of each day, all payment-related activities (receiving and spending), including dollar amount, spending type, merchant type, and payment method as well as money transfers.
Asked in 2017 what payment instruments they prefer to use, 2 percent of U.S. consumers said they preferred checks for purchases and 14 percent said they preferred them for bills.
In a paper with Marcin Hitczenko and Brian Prescott, we used logistic regression to estimate the likelihood that a consumer states that he or she prefers to pay with a check for bill payments, based on the consumer's demographic characteristics, including household income. The other demographic attributes of each consumer include age, gender, race (Asian, Black, White, other), ethnicity (Latinx), education level, employment status, marital status, household size, homeownership status, and community type (rural, urban, or mixed).
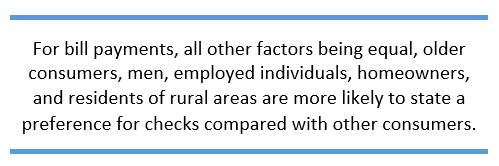
Because so few consumers prefer checks for purchases, we focus on bill payments. For bill payments, all other factors being equal, the probability that a consumer states a preference for paying with checks (relative to other means of payments) increases for older consumers (relative to young), men (relative to women), employed individuals (relative to not employed), homeowners, and residents of rural areas. In addition, people with household income greater than $75,000 were less likely to state a preference for checks, compared with other consumers.
Age is most relevant to stating a preference for checks. Each year of age increases the likelihood that a consumer will state a preference for checks by about one-half of a percentage point. Thus, compared to an 18-year-old consumer, a consumer who is age 51 is 16 percentage points more likely to state a preference for checks. Homeowners are 7.4 percentage points more likely than nonhomeowners to say they prefer to use checks to pay bills.
Who uses paper checks and in what situations?
In practice, consumers' stated preferences do not necessarily match their behavior. In 2017, for example, a little less than half of bills recorded in the Diary of Consumer Payment Choice were paid by the consumer's preferred method. Therefore, we also look at what consumers actually do.
Understandably, to pay with a check, a consumer must have checks on hand. In 2018, 78 percent of U.S. consumers had paper checks in their possession.
Also with Hitczenko and Prescott, we estimate the likelihood that a payment is made with a check, allowing for variation due to the dollar value of the payment, payee or bill type, household income, and consumer demographic characteristics. We cannot factor in how often consumers with particular demographic characteristics make various transactions. Therefore, this analysis cannot determine whether consumers in certain demographics make more or fewer check payments than those in other demographics, only how likely they are to use a check for a given transaction.
We find that factors including the payment's dollar value, the merchant (payee or purpose of payment), age, ethnicity, race, and community type are all relevant to a consumer's choice to pay with a check. As prior research on payment choice for both purchases and bills has found, dollar value is highly statistically significant for payment instrument choice. For example, a $100 increase in payment value—from $50 to $150—results in an average 2.4 percentage point increase in the probability that a consumer will choose to use a check.
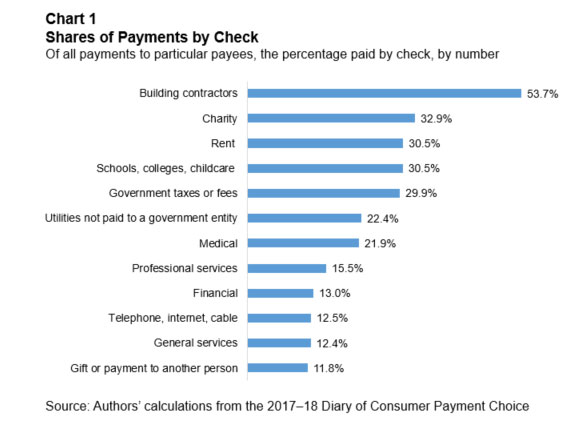
Merchant type is also important for the choice to use, or not use, a check. Generally speaking, consumers were less likely to use paper checks for payments associated with food (restaurants, bars, fast food, and coffee shops) and travel (gas stations and hotels, motels, and campsites). Note that these payments are likely to be made in person. Consumers were more likely to use paper checks for merchant types associated with bills (school, nongovernment utilities, government taxes and fees, and rent) and highly likely to be used to pay contractors (plumbers, electricians, and so forth). For the top three payees in chart 1, the use of a check as proof of payment also could be important to consumers.
Age, as might be expected, is important for the choice to pay with a check (as we saw above with the preference for using a check for bill payments; see the table).
Percentage of All Payments Made with Paper Check and Cash, by Age (2018)
| Under 25 | 25–34 | 35–44 | 45–54 | 55–64 | 65+ | |
|---|---|---|---|---|---|---|
| Percentage of payments by check | 0 | 4% | 5% | 5% | 7% | 10% |
| Percentage of payments in cash | 36% | 19% | 21% | 29% | 31% | 32% |
Source: Authors' calculations from the 2017–18 Diary of Consumer Payment Choice
When do consumers choose cash?
Over the last decade, in contrast to paper checks, the Survey of Consumer Payment Choice has found relative stability in the percentage shares of consumer payments using cash. In 2009, U.S. consumers age 18 and older made 28.2 percent of their payments with cash; in 2018, 23.5 percent.3 In addition, over the decade, 100 percent of U.S. consumers 18 and older continue to adopt cash; that is, they have some in pocket, purse or wallet, or stored elsewhere or they have made at least one cash payment in the prior 12 months.
As was found with checks, dollar value is important for consumers' choice to use cash. Cash is particularly popular for low-dollar-value payments. In the combined sample of the 2017–18 Diary of Consumer Payment Choice, for example, over 60 percent of all payments not over $5 were made with cash. From there, the use of cash declines with increasing dollar value. Consumers used cash about half the time for payments of less than $10 and one-third of the time for payments of between $10 and $24.99. Perhaps surprisingly, cash also was used for 8 percent of payments of $100 or more.
Many empirical researchers have noted the importance of dollar value in the choice to use cash. Another paper by Oz Shy finds that not only the low or high value but also the exact value—that is, in multiples of $20s—is relevant for the consumer's choice to use cash. In the United States, $20 bills are the most common denomination dispensed by ATMs.
Looking at the mix of all payments (see chart 2), Shy found that the sharpest changes in the share of cash payments occur between $19 and $21 and between $39 and $41. A machine-learning algorithm was used to focus on buyers' choice between paying with cash and paying with checks, credit, debit, and prepaid cards. It turns out that a large number of consumers switch from paying with cash to paying with cards for payment amounts exceeding the $20 and $40 thresholds.
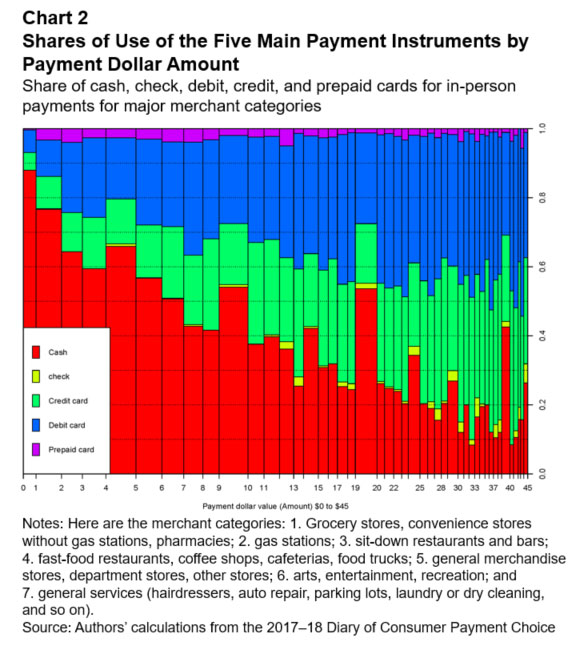
These thresholds are relevant to the amounts of cash that consumers typically obtain. Our research finds that when U.S. consumers get cash, about half the time they obtain cash in exact multiples of $20. Somehow, the prevalence of $20 currency notes enters consumers' minds in the sense that it affects their choice among payment instruments used for in-person purchases.
As we describe above for the preference and use of checks, consumer demographic factors, including income and banking status, also come into play. For example, consumers without a bank account make about two-thirds of their payments with cash, according to the 2018 Survey of Consumer Payment Choice. And the research above on the denominations cliff also found differences in the choice to use cash based on household income and education.
Previously, we noted that age was related to a stated preference for using paper checks for bill pay and also to the use of paper checks generally. People between the ages of 25 and 44 use cash less than older people. They still choose cash for about 20 percent of their payments, however (see the table). The large share of payments made in cash by the 18–25 group likely relates to their adoption of fewer payment instruments, due to stage of life, so it does not necessarily predict a resurgence in the use of cash by younger generations. Compared to checks, the age-related difference in the use of cash is less pronounced yet still present.
The emergence of no-cash-accepted-here retail outlets raises concerns about the impact of going cashless. As a result, cities and states have recently passed laws requiring that cash be accepted at the in-person point of sale. The most recent city to enact such a law is New York, where the city council passed legislation on January 23, 2020. Oz Shy posted on the potential impact of cashless retail in a 2019 Notes from the Vault. Among other findings, of survey respondents in households below the 2017 U.S. median income of $61,372, 6.7 percent had neither a debit card nor a credit card and, therefore, could not pay with either type of card for their in-person purchases. Read the full post here.
Prognosis for paperless payments
Over the past 70 years, many paperless payment instruments have been introduced in the United States. For decades, these newer payment instruments have coexisted with paper ways to pay. While we see a decline in the use of paper payment instruments, that long history makes us reluctant to predict their extinction.
Although the check remains, the process of collecting checks has changed dramatically since the turn of the century, when a large fraction of paper checks were physically transported back to the payer's bank. Now, almost all checks are converted to electronic images when first deposited and the paper check is truncated. Ironically though, this development, which came about after the 2003 passage of the Check 21 Act, has likely had the effect of extending the life of the paper check by recognizing check substitutes (such as images taken by a phone camera) and thus simplifying the process of making check deposits.
One of the earliest high-profile attempts to replace paper payment instruments with electronic instruments in the country dates back to the 1998 Visa Cash smart card. Just like the Mondex card, cash was stored on a chip (rather than on a server, as is the case of today's credit and debit cards). This technology allowed, with proper equipment, a transfer of e-cash from one card to another. The key to this technology was that e-cash allowed for anonymous transactions, a feature that is generally unique to cash. The experiment was conducted on Manhattan's Upper West Side and lasted for 15 months. The experiment ended for no particular reason and was never repeated in the United States.4 Despite predictions that this experiment marked the beginning of the end of paper, that turned out not to be the case.
Claire Greene is a payments risk expert and Oz Shy is a senior policy adviser and economist at the Federal Reserve Bank of Atlanta. The authors thank Marcin Hitczenko and Brian Prescott for their contributions to the research described here and Larry Wall for helpful comments. The views expressed here are the authors' and not necessarily those of the Federal Reserve Bank of Atlanta or the Federal Reserve System. If you wish to comment on this post, please email atl.nftv.mailbox@atl.frb.org.
_______________________________________
1 See Bagnall, John, David Bounie, Kim P. Huynh, Anneke Kosse, Tobias Schmidt, Scott Schuh, and Helmut Stix (2014). "Consumer Cash Usage: A Cross-Country Comparison with Payment Diary Survey Data." Federal Reserve Bank of Boston Working Paper 14–4.
2 The DCPC is a collaboration of the Federal Reserve Banks of Atlanta, Boston, and San Francisco (Cash Product Office). The data are publicly available to download from the Federal Reserve Bank of Atlanta and are summarized in Kumar, Maktabi, and O’Brien (2018) and Greene and Stavins (2018).
3 Table 20 in the 2009 Survey of Consumer Payments Choice and table 5 in the 2018 Survey of Consumer Payments Choice. Both can be downloaded from https://www.frbatlanta.org/banking-and-payments/consumer-payments/survey-of-consumer-payment-choice.aspx?panel=2.
4 For a full description of this experiment, see Van Hove, Leo (2001). "The New York City Smart Card Trial in Perspective: A Research Note." International Journal of Electronic Commerce 5, no. 2, Winter 2000–01. Available at https://ssrn.com/abstract=259900.