Notes from the Vault
Oz Shy
May 2019
Imagine entering a store, picking up a few items, and then exiting the store without going through a checkout counter. No, this scenario isn't necessarily a theft, as a chip embedded under the buyer's arm or in her mobile device is scanned on the way out of the shop and a cashless payment is made. It sounds like an efficient transaction. However, digging into the question of how consumers fund these payments reveals that not all consumers can benefit from such payment systems. That’s because not all consumers have credit cards, debit cards, or even bank accounts, which are needed for funding cashless payments.1 In fact, recognizing the possibility that some sports fans carry only cash to sporting events, the Mercedes-Benz Stadium in Atlanta—which became cashless this year—provides reverse ATMs where consumers insert cash and get back a prepaid card.2
The emergence of cashless stores has led several cities and states to ban them. Philadelphia's new law will require most retail stores to accept cash. Cashless businesses are already banned in Massachusetts and more recently in New Jersey.3
Without getting into the debate about whether cashless stores should or should not be banned, it is important to look at payments data in order to be able to characterize consumers who are most likely to pay cash, the type of purchases paid with cash, and consumers who do not have credit or debit cards. This post summarizes my recent working paper, which explores this issue by characterizing consumers who pay cash for in-person purchases and consumers who do not have credit or debit cards.
How consumers pay for in-person purchases
As a part of fulfilling its ongoing responsibilities in retail payments, the Federal Reserve conducts periodic surveys of consumers’ usage of different payments mechanisms. The data in this post are taken from the 2017 Survey and Diary of Consumer Payment Choice (SCPC and DCPC), which are conducted in collaboration with the Federal Reserve Banks of Atlanta, Boston, Richmond, and San Francisco (Cash Product Office). The data and assisting documents (codebooks) are publicly available for downloading from the Atlanta Fed. The data contain weights for all respondents that can be used to match the data with the adult U.S. population who are 18 and older. I indicate when the reported statistics are computed with weights either by (weighted) or (w) inside tables.
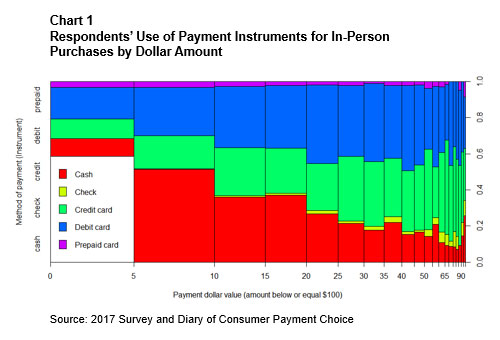
Chart 1 shows the proportion of payments made with cash, check, debit card, credit card, and prepaid card. This chart (and all the reported statistics that follow) are based on 7,313 payment observations of in-person purchases made by 2,062 survey respondents in six merchant categories during October 2017.4
Who doesn’t have a card?
Survey respondents provided information about their key demographic variables, including yearly household income and whether they have debit and credit cards (called "card adoption").
The data show that 3.4 percent of the respondents (4.7 weighted) reported not having any credit or debit card. The data also show that 66.9 percent (67.2 weighted) have both cards, 16.4 percent (19 weighted) do not have credit cards (but may or may not have debit cards), and 17.9 percent (17.4 weighted) do not have debit cards (but may or may not have credit cards). It must be emphasized that numbers apply only to the 2,062 respondents who actually made in-person purchases during their diary days (which is a subsample of all survey respondents).5
Chart 2 displays respondents' card adoption profile with respect to their yearly household income not exceeding $120,000. Uneven spacing on the x-axis reflects the relative number of respondents in the relevant income category.
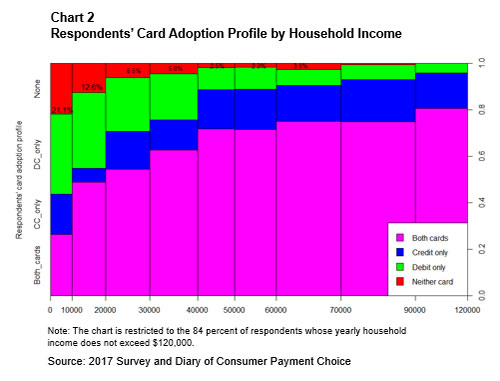
Chart 2 shows that higher household income is correlated with credit card adoption. The sharp increase in credit card adoption from zero to $50,000 household income is expected, given that credit card issuers in the United States base their credit card approval (as well as credit line) on cardholders' household income. Interestingly, chart 2 shows that the nonadoption of cards remains between 2 percent and 3 percent even at higher household income levels up to $70,000, which is higher than the median 2017 U.S. family income of $61,372. In fact, regrouping all income categories below the 2017 median income shows that the average nonadoption rate of cards was 8.5 percent. This means that 8.5 percent of respondents with household income below the median level could not pay with debit or credit cards for their in-person purchases.
Card adoption and the use of cash
Table 1 displays how the use of cash varies with respondents' adoption (possession) of credit and debit cards: 32.6 percent (30.4 weighted) of the payments made by respondents who carry both cards were made with cash, compared with 86.4 percent (93.1 weighted) of cash payments made by respondents who do not have credit or debit cards.
In dollar value, the average cash payment made by respondents who carry both credit and debit cards was $14.12, compared with the $29.59 average cash payment made by respondents who do not have any debit or credit cards. This is because respondents who have both cards use cash mostly for low-value purchases, whereas respondents who do not have credit or debit cards use cash for most of their purchases, including high-value payments.
The bottom three rows in table 1 show how respondents with no credit or debit cards allocate their purchase payments between cash and prepaid cards, which are the only practical means of payment available to them. For these respondents, 86.4 percent (93.1 weighted) of the payments were made with cash and 12.2 percent (6.5 weighted) were made with prepaid cards.
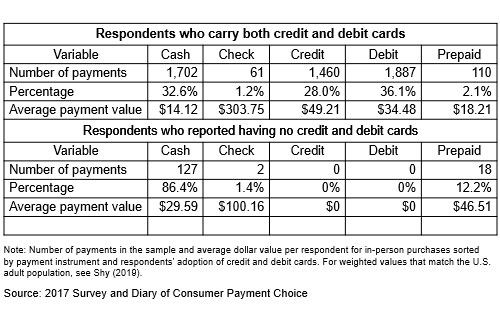
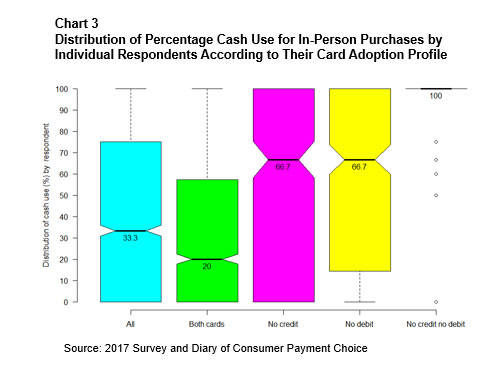
Chart 3 displays five box plots where each plot is restricted to respondents who share the same card adoption profile. The solid horizontal line in each box marks the median percentage use of cash (for in-person purchases) relative to the payment instruments available to the respondent within each card adoption category. For instance, the second plot focuses on respondents who carry both credit and debit cards. Within that group, half of the respondents used cash for less than 20 percent of their transactions. The bottom edge of this box marks the lower quartile (25th percentile), which happens to be zero for that group. This implies that at least a quarter of respondents who carry both credit and debit cards did not use cash for in-person purchases. The upper edge of this box marks the upper quartile (75th percentile), which is 57.14 percent. That is, three-quarters of these respondents used cash for less than 57.14 percent of their transactions.
In contrast to respondents who carry both cards, the box plot on the right in chart 3 shows that all respondents who do not have any credit or debit card pay cash, with the exception of a few outliers marked by the small circles. These outliers correspond to the few paper check and prepaid card payments made by respondents in that group; see the bottom three rows in table 1.
Conclusion
A complete transition to cashless stores would be extremely difficult in any country (if not impossible), particularly because cash use at the point-of-sale remains strong in most countries. A study by Bagnall et al. (2016) compares payment diaries from seven countries and shows that cash still dominates low-value transactions, especially lower than $25. Khiaonarong and Humphrey (2019) measure the demand for cash in 11 countries. Further studies on cash use include Schuh and Stavins (2010), Arango, Huynh, and Sabetti (2015), Bounie, Francois, and Waelbroeck (2016), and Wakamori and Welte (2017). Chen, Huynh, and Shy (2019) show how the decision of whether or not to pay with cash is influenced by the burden of receiving coins as change.
The empirical findings explored in this post and in the above literature raise the question whether it is possible to measure the burden on cash users in the hypothetical scenario in which all stores become cashless. My recent working paper constructs a theoretical model assuming prepaid cards are the only alternative to cash for consumers who do not have credit and debit cards. The model attempts to measure how the burden of switching from cash to prepaid cards varies with consumers’ cost of using these two payment instruments.
Finally, unlike the United States, some countries have managed to achieve some ubiquity in the use of cashless payment instruments based on apps installed on mobile devices. Ubiquity relies on market dominance of one or two mobile money transmitters that charge low (near zero) fees to merchants who accept payments using these services. This seems to be the direction China is taking via the dominance of WeChat and Alipay, and in Kenya via M-Pesa, which operates via local kiosks that convert cash to mobile money and vice versa. Similar services in other countries include Bankgirot in Sweden, Paym in the United Kingdom, and Paytm in India.
References
Arango, Carlos, Kim Huynh, and Leonard Sabetti. 2015. "Consumer Payment Choice: Merchant Card Acceptance Versus Pricing Incentives," Journal of Banking and Finance 55, 130–141.
Bagnall, John, David Bounie, Kim Huynh, Anneke Kosse, Tobias Schmidt, Scott Schuh, and Helmut Stix. 2016. "Consumer Cash Usage: A Cross-Country Comparison with Payment Diary Survey Data," International Journal of Central Banking 12(4): 1–61.
Bounie, David, Abel Francois, Abel, and Patric Waelbroeck. 2016. "Debit Card and Demand for Cash," Journal of Banking and Finance 73, 55–66.
Chen, Heng, Kim Huynh, and Oz Shy. 2019. "Cash Versus Card: Payment Discontinuities and the Burden of Holding Coins," Journal of Banking and Finance 99, 192–201.
Khiaonarong, Tanai and David Humphrey. 2019. "Cash Use Across Countries and the Demand for Central Bank Digital Currency," International Monetary Fund Working Papers 19/46.
Schuh, Scott and Joanna Stavins. 2010. "Why Are (Some) Consumers (Finally) Writing Fewer Checks? The Role of Payment Characteristics," Journal of Banking and Finance 34(8): 1745–1758.
Shy, Oz. 2019. "Cashless Stores and Cash Users." Federal Reserve Bank of Atlanta Working Paper 2019-11.
Wakamori, Naoki, and Angelika Welte. 2017. "Why Do Shoppers Use Cash? Evidence from Shopping Diary Data," Journal of Money, Credit and Banking 49(1): 115–169.
Oz Shy is a senior policy adviser and economist at the Federal Reserve Bank of Atlanta. The author thanks Larry Wall for helpful comments. The views expressed here are the author's and not necessarily those of the Federal Reserve Bank of Atlanta or the Federal Reserve System. If you wish to comment on this post, please email atl.nftv.mailbox@atl.frb.org..
_______________________________________
1 The source of funding is a crucial ingredient in any payment activity. A mobile phone, for example, is not a payment instrument. A mobile phone uses software (apps) to connect a payer with a payee, which is also not a payment instrument because software, such as Venmo, Cash App, Google Pay, PayPal, and Apple Pay, must be funded by some payment instruments such as debit cards, credit cards, or bank account numbers that provide the source of funding.
4 The merchant categories are: (1) grocery stores, convenience stores without gas stations, pharmacies, (2) gas stations, (3) sit-down restaurants and bars, (4) fast-food restaurants, coffee shops, cafeterias, food trucks, (5) general merchandise stores, department stores, other stores, and (6) general services: hairdressers, auto repair, parking lots, laundry or dry cleaning, etc.
5 For all the 3,099 survey respondents (including those who did not take part in the diary), 65.2 percent (63.2 weighted) had both credit and debit cards; 21.7 percent (23.3 weighted) did not have a credit card; 23.6 percent (17.8 weighted) did not have a debit card, and 7.7 percent (6.8 weighted) did not have credit or debit cards.