Notes from the Vault
Mark Fisher and Brian Robertson
August 2016
The market's assessment of the future path of short-term rates is an important topic for policymakers, financial market participants, and observers alike.1 This was particularly true in late June this year, when uncertainty surrounding the United Kingdom's vote to leave the European Union gripped the financial markets and many wondered what this might mean for monetary policy here in the United States. As we highlighted in a recent macroblog post, looking at options on Eurodollar futures can help to better infer the implied probabilities the market places on future target ranges, by allowing for a broader range of possible rate changes.
We introduce our implied probability estimates tool based on Eurodollar option prices, now available on the Market Probability Tracker page. The estimates cover the four-nearest expiring quarterly contracts. The data are updated daily using the previous day's closing prices. For comparison, we retain approximately six weeks of data. In addition, we provide for the user the implied probability the three-month average fed funds rate will be above a wide range of rates.
In this Notes from the Vault post, we provide an overview of our approach. We begin with some the institutional detail of the data we use. We then discuss the intuition of our model and how our approach differs from other commonly used ones. Lastly, we provide some examples to illustrate how this tool can be used to measure the effect new data have on the market's assessment of the probabilities of future short-term rates.
An overview of our approach
We begin with some institutional detail and a bit of interest rate theory.2
Federal Reserve monetary policy has traditionally focused on controlling short-term interest rates through the fed funds rate.3 The fed funds rate is the rate charged on overnight (one-day) loans between depository institutions and other eligible parties that are used to maintain required balances with the Federal Reserve. The Federal Open Market Committee (FOMC) announces a target range at the end of each of its meetings.4 There are a variety of tools at the FOMC's disposal to operationally control short-term interest rates, and the fed funds rate typically trades somewhere near the middle of this range through the subsequent intermeeting period.5
With this in mind, it follows that future short-term rates will be determined by future FOMC target ranges. Consider a future FOMC meeting. There will be a number of possible target ranges the FOMC could announce. That number grows the farther the meeting is into the future.6 Each possible target range will have a market-based probability associated with it.
Fed funds futures can be used to help infer the probabilities of future target ranges because their values are tied directly to the expected fed funds rate. Moreover, these contracts are actively traded. In fact, two popular tools, the CME’s FedWatch Tool and Bloomberg's World Interest Rate Probability (WIRP) measure, both use fed funds futures to infer the implied probability of future FOMC decisions.7 Although these tools are useful, the methods they are based on have some drawbacks in that they make potentially restrictive assumptions about the size and direction of possible rate moves as well as where within the range fed funds will trade.8
Options on fed funds futures also contain additional information about future target ranges. These contracts give the holder the right, but not the obligation, to buy or sell fed funds futures at a predetermined price (called the strike price). The prices at which options on fed funds futures trade convey information about the expectations of whether and to what extent the fed funds rate will be above (or below) the rate implied by the strike price. Thus, options contain information about the market's assessment of the path of overnight rates. Using options of the same maturity but varying strike prices, it is possible to estimate what this assessment looks like. Unfortunately, the availability of these contracts is limited, especially if we look more than a few months into the future.
The target range for the fed funds rate has a strong impact on other short-term interest rates as well. In particular, consider the U.S. dollar London Interbank Offer Rate, or LIBOR: the interest rate charged on Eurodollar deposits.9 Because Eurodollar deposits are regulated similarly to fed funds and can be used to meet reserve requirements, financial institutions view them as close substitutes for fed funds. Arbitrage and competitive forces will keep overnight U.S. dollar LIBOR and the fed funds rate very close, typically within a few basis points of each other.
Given the close relation between overnight Eurodollar rates and overnight fed funds rates, we can interpret U.S. dollar LIBOR with maturities longer than one day as the sum of two components:
- The expectation of the average overnight fed funds rate over the subsequent term
- A term premium that depends on a number of factors, including uncertainty about the path of short-term rates, the credit risk associated with the large banks involved in the LIBOR market, and other factors unique to Eurodollar deposits.
Term premiums drive a wedge between U.S. dollar LIBOR rates and the fed funds rate. For example, in the past, term premiums typically have been small (roughly 15 basis points); an increase in premiums has often indicated an increase in risk to the financial system since some of the largest and safest banks in the world are among the financial institutions that report U.S. dollar LIBOR rates.10 More recently, changes in global financial conditions and the implementation of new regulations have caused term premiums to increase to between 35 and 40 basis points.
Fortunately, for our purposes we do not need to decompose the term premiums into their components. Moreover, a market-based measure of the term premiums can be obtained from the swaps market.
As a result, we can use Eurodollar futures and options on Eurodollar futures, which derive their value from the market's expectation of the three-month U.S. dollar LIBOR, to extract additional information about the expected future path of short-term rates. This is particularly attractive, given these are highly liquid markets and there are a large number of options contracts through which we can make inferences about the market's assessment of future FOMC decisions beyond a few meetings.
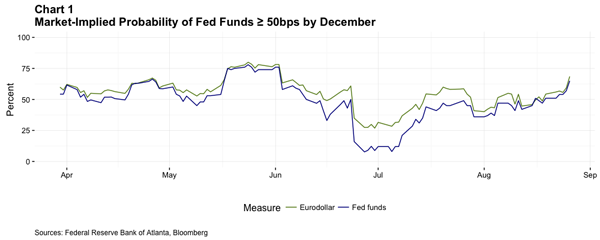
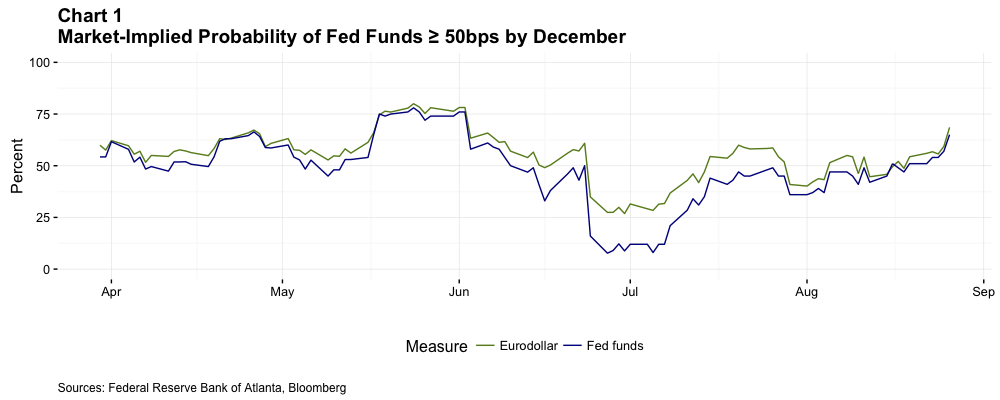
Our approach provides a complementary and potentially richer view of market expectations than is provided by fed funds futures data alone. For example, we can calculate the implied probabilities of a rate change using options on Eurodollar futures (green line) consistent with what you would get by simply using fed funds futures (blue line) as shown in chart 1.
How the model works
The price of an option contract is primarily based on two things: a payoff at some point in the future and the probability of that payoff occurring. The task is to extract the probability distribution from a collection of option prices.11 A typical approach involves making an assumption about the shape of the underlying probability distribution. For instance, one could fit the data using a normal (bell-shaped) distribution. The famous Black-Merton-Scholes option pricing model takes this approach. This approach is popular because estimating these distributions is computationally easy (calculators since the 1970s have been programmed to solve the Black-Merton-Scholes model).
However, there is a drawback to using a distribution with a predetermined shape: the underlying distribution may not have that shape. In order to overcome the limitations of using fixed-shape distributions, we employ a mixture of basis distributions with varying shapes to represent the underlying distribution implied by the swap-adjusted Eurodollar futures option premiums. An example of this can be seen in chart 2.
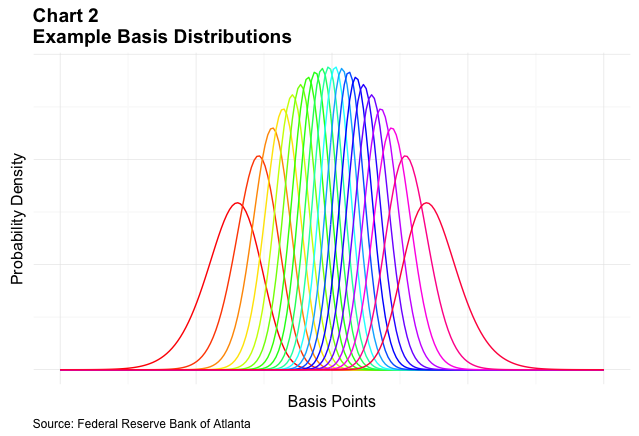
In chart 2, we show 20 basis distributions.12 The distribution we uncover is a weighted average of these basis distributions. The inferential challenge is to estimate the weights. We take a Bayesian approach to inference, in part because it allows us to estimate very flexible distributions where the number of unknown weights may be larger than the number of observations. The result is a distribution with as few restrictions as possible on the underlying shape. For a more detailed discussion of the model and how it is applied to options on Eurodollar futures specifically, we suggest you check out the following resources here and here.
In order to illustrate the difference between the two approaches, take, for instance, the data on August 24, 2016, for options on Eurodollar futures expiring in December. Estimates based on the two approaches are shown in chart 3. The (swap-) adjusted futures rate was 54 basis points (dotted line), which we can think of as the expectation of the average fed funds rate over the three months starting when the contract expires.
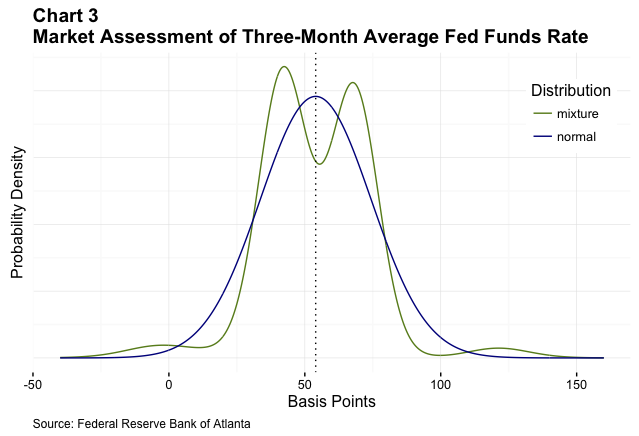
As mentioned earlier, there are a number of possible target ranges the FOMC could choose in the future. This gives rise to the possibility of multimodal (multiple-peaked) distributions as market participants assess the likelihood of each possible target range and express some amount of certainty around that likelihood. So while the market's "expectation" for the three-month average fed funds rate is 54 basis points, upon closer inspection we find the market is actually divided in its assessment whether rates will either stay where they are or will increase by December (green curve). This specific feature of the data would have been obscured had we assumed the data behaved according to a more restrictive distribution, such as the normal distribution (blue curve).
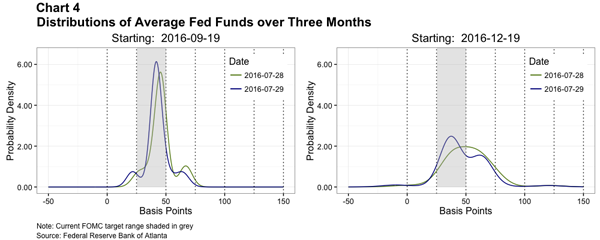
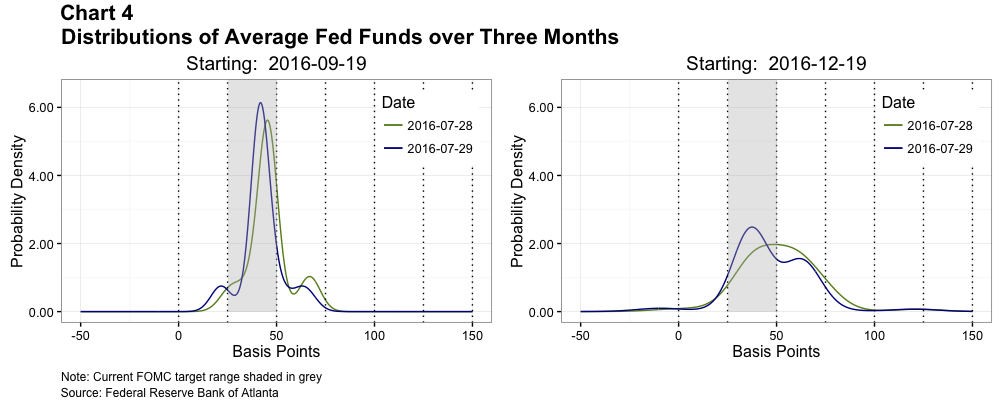
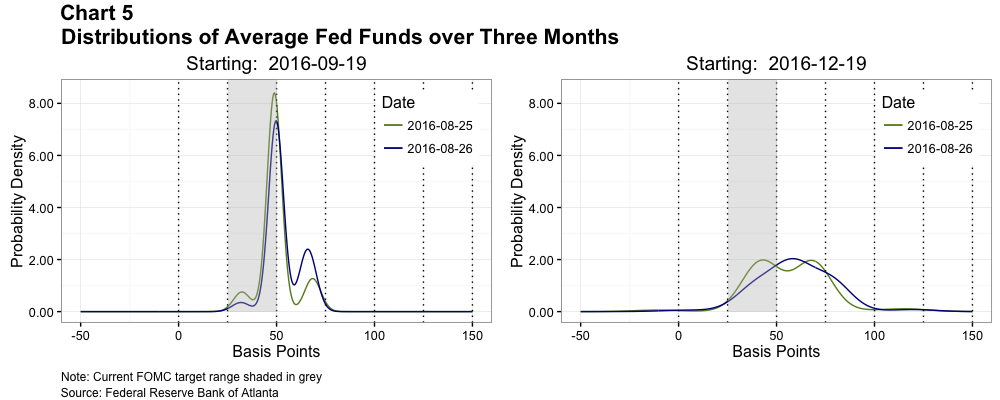
Let us examine some examples of the implied probability distributions that we produce. We begin with chart 4. We will discuss the substance of the distributions in a moment, but first we provide some discussion of structure of the distributions. In the first panel, the probability distribution displays three peaks (also known as "modes"). Each of these peaks corresponds to a possible target range. There are three features associated with each peak: its height, location, and width. We discuss each of these in turn. The height of a peak is related to the market's probability that the associated target range will be chosen—the higher the peak, the greater the probability. The location of a peak indicates its associated target range. Note that the peaks are not necessarily located at the centers of their target ranges. This is because the location reflects the market's expectation of where the average overnight funds rate will be over the subsequent three months—and this window includes additional FOMC meetings with their additional target range possibilities. The width of the peaks reflects the market's uncertainty about the future term premium. This uncertainty increases as we look farther into the future. In fact, the peaks can be wide enough that they become difficult to distinguish and even merge into one. This effect can be seen in the second panel. With this understanding of the structure in mind, let us examine the substance of the distributions.
Last month's second-quarter GDP report provided evidence the economy was growing at a slower rate than many professional forecasters anticipated. Prior to the report (green curve), market participants assigned the highest amount of likelihood to the FOMC leaving rates in their current target range of 25 basis point to 50 basis points (grey shaded region) after September's meeting (left panel). Following the report, while there was little change to this assessment (blue curve), market participants did assign a higher likelihood to the FOMC leaving rates in their current target range through the December meeting as well (blue curve, right panel).
More recently, Chair Janet Yellen’s speech at the Kansas City Fed’s Economic Symposium at Jackson Hole, Wyoming, on August 26 provided us with insight into how the FOMC might behave in the future, which gives us an opportunity to see how the market reacted to it. In her speech, Yellen noted the economy's current progress possibly warranted further rate increases in the future. Although market participants raised their assessment of a rate increase by September only somewhat following her comments (see chart 5, left panel, blue curve), the change in their assessment of a rate increase in December was more pronounced (right panel, blue curve). Here we see participants go from being roughly split on whether a rate increase will occur (green curve) to now assessing a higher likelihood a rate increase will happen by the end of the year.

Conclusion
The Federal Reserve provides a variety of information about the likely path of the fed funds rate both through the statements of the FOMC and speeches by senior Federal Reserve officials, including those by the Chair. Participants in the LIBOR options market combine this information with observations about past Fed performance and their own economic projections to estimate a distribution of the future rates with which to price the options. Estimating the distribution implied by market prices provides a wealth of information to policymakers, those involved in financial markets, and those generally interested in monetary policy.
Fed funds futures rates have a straightforward interpretation provided the FOMC is facing a limited number of policy moves. However, at times of elevated uncertainty about the economy and/or the financial system, there may be a variety of plausible options facing the committee. In this case, the extra detail provided on options on Eurodollar futures can provide additional information about how market participants are evaluating the economy, financial system, and the FOMC.
Mark Fisher is a financial economist and associate policy adviser and Brian Robertson is a quantitative research analysis specialist, both in the research department at the Atlanta Fed. The authors thank Paula Tkac and Larry Wall for helpful comments. The view expressed here are the authors' and not necessarily those of the Federal Reserve Bank of Atlanta or the Federal Reserve System. If you wish to comment on this post, please email atl.nftv.mailbox@atl.frb.org.
_______________________________________
1 The expected path of short-term interest rates is one of the major determinants of the entire yield curve.
2 For the most part, we will describe current institutional details, which differ in some respects from those before the financial crisis.
3 However, the Fed tried to influence the slope of the term structure in 1961 by what was called “Operation Twist.” Since the crisis the Fed has again sought to influence the slope of the term structure via its large-scale asset purchases (LSAP, sometimes called quantitative easing or QE) and also via its maturity extension program.
4 In the current regime, the width of this target range is 25 basis points.
5 Traditionally, this was accomplished by managing the amount of already scarce reserves in the system through open market operations via the Open Market Trading Desk at the New York Fed. Given the large volume of excess reserves outstanding since 2008, the FOMC has expanded its tools to include interest on excess reserves and conducting overnight reverse repurchases.
6 Suppose there are three possible target ranges the FOMC could adopt at any meeting: lower rates, leave rates where they are, or raise rates. Therefore, at the first meeting in the future there are three possibilities. Going two meetings into the future increases the number of possible target ranges to five, three meetings produces seven possible ranges, and so on.
7 WIRP is available to subscribers of Bloomberg's data service.
8 These tools only allow for two possibilities at each FOMC meeting.
9 Eurodollar deposits are deposits held outside the United States in foreign banks or the foreign branches of U.S. banks. The Richmond Fed has a comprehensive discussion on Eurodollar deposits and their role in the financial system.
10 For example, during the extreme market turmoil of 2007 and 2008, term premiums rose to over 200 basis points.
11 Technically speaking, the probability distribution encoded in option prices is the so-called risk-neutral distribution. We assume the difference between this distribution and the market's distribution is small.
12 In our estimation we use 80 basis functions.