
In September, news headlines touted a large jump in U.S. household incomes. How did states and communities across the Southeast fare? Did they keep up with the national trend? This article uses recent U.S. Census Bureau data to provide a snapshot of the economic well-being of states across the Southeast.1
Median household incomes
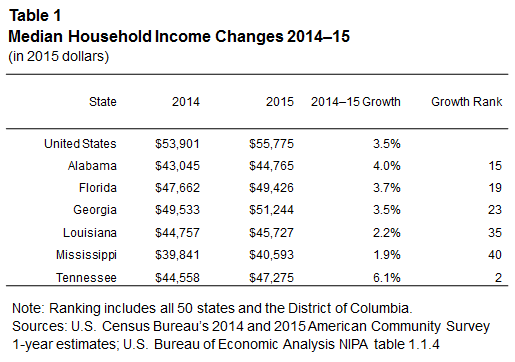
The year 2015 brought substantial growth in household incomes (see table 1). Most states in the Southeast—including Alabama, Florida, and Georgia—saw increases similar to the national trend, and median household incomes in Tennessee grew fastest in the region at 6.1 percent. In fact, incomes in Tennessee saw the second highest growth of any state in the country, trailing slightly behind Montana's 6.4 percent increase. While Louisiana and Mississippi did see higher median household incomes in 2015, their growth rates of 2.2 and 1.9 percent lagged the national trend.
There is significant variation in median household income changes among various demographic groups.
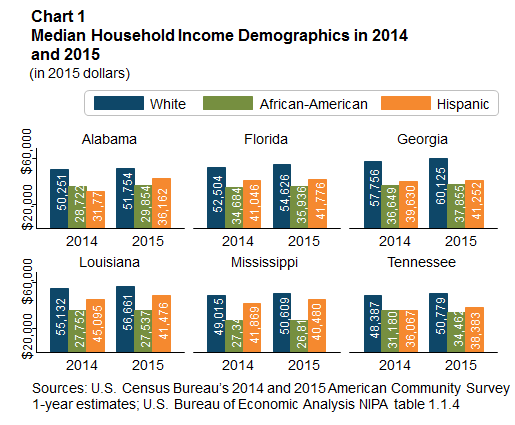
In all southeastern states, income growth in real terms for whites was greater than the national 2.6 percent increase, ranging from 2.8 percent in Louisiana to 4.9 percent in Tennessee. In contrast, household incomes for African-Americans also increased by 2.6 percent, while estimates of changes across the Southeast ranged from declines of 1.9 percent in Mississippi and 0.8 percent in Louisiana to growth of 3.3 percent in Georgia and 10.5 percent in Tennessee. Hispanics in Louisiana and Mississippi appear to have faced income declines, while those in Alabama, Florida, Georgia, and Tennessee saw inflation-adjusted gains.
Poverty rates
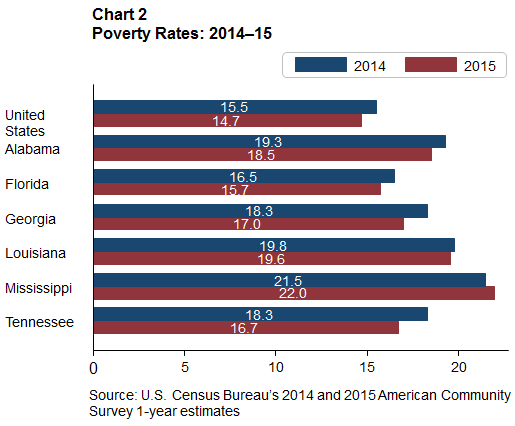
Mississippi has the highest poverty rate in the nation and experienced the greatest increase of all U.S. states (only four states saw their poverty rate climb between 2014 and 2015). Louisiana (third), Alabama (fifth), and Georgia (10th) are also among the 10 states with the highest poverty rates, with Tennessee (11th) close behind. In contrast to Mississippi, however, all other southeastern state saw their poverty rate decline, albeit just slightly in Louisiana. Tennessee experienced the largest decline in the incidence of poverty, a 1.6 percentage point drop, which is double the national decline.
Rent burdens
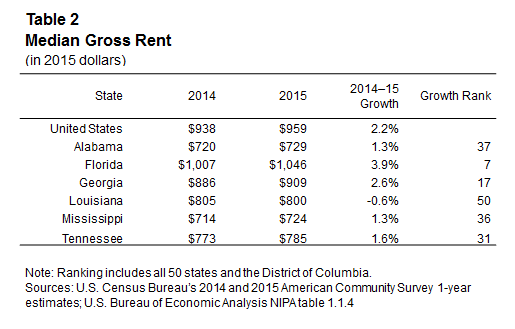
Another indicator of the economic well-being of low- and moderate-income households is the extent to which households are "rent burdened"; that is, the share of renter households that pay 30 percent or more of their monthly income on rent. First, inflation-adjusted median rents rose more sharply than they did nationally in Florida and Georgia (see table 2). Louisiana actually saw a small decline in median rents; it was the only state beside Alaska to experience a drop in this measure between 2014 and 2015. Tennessee, Mississippi, and Alabama saw rents rise, but at a slower rate than the national trend.
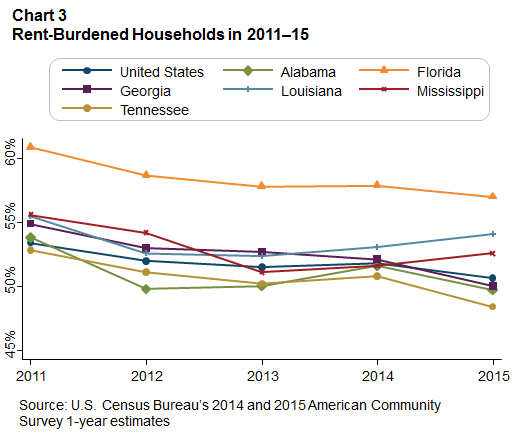
While all Sixth District states show an improvement in the share of their rent-burdened households between 2011 and 2015 (see chart 3), more recently, between 2013 and 2015, Louisiana and Mississippi both experienced an uptick, to 54.1 and 52.6 percent of renter households, respectively. As the chart shows, while there is somewhat of a declining trend, Florida's share of rent-burdened households is significantly greater than the national average. In fact, Florida has the highest share of cost-burdened renters out of all states, beating out Hawaii and California for the top spot.
One factor that could be contributing to Florida's rental affordability challenge is a significant loss of low-cost rental units in the past several years. A recent Atlanta Fed Community and Economic Development discussion paper outlined loss of hundreds to thousands of low-cost rental units across various Florida cities between 2010 and 2014. For instance, Jacksonville saw a loss of 2,378 units that charged less than $500 a month during that time period, a 19.7 percent reduction in stock; and Miami lost 2,133 such units, a 14.3 percent drop. These cities also experienced smaller declines in units that charged from $500 to $750 a month, but saw large double-digit gains in the supply of higher-end rental units that charge more than $1,500 a month. The paper found an association between the loss of such units and higher shares of low-income rent-burdened households.
Bright spots and troubling trends
The various indicators presented above offer a mixed picture. States like Louisiana and Mississippi are underperforming national economic trends. Both have seen lackluster growth in incomes, with African-Americans and Hispanic households even facing real income declines between 2014 and 2015. Tennessee, on the other hand, has experienced strong income growth, with all demographic groups seeing significant gains in real incomes. This has additionally translated into a lower share of rent-burdened households and a reduced poverty rate. The state is outperforming the national average and the national trend, and it is closing the poverty rate gap among all demographic groups. While Florida has seen a reduction in poverty and growth in household incomes that closely track national trends, its rental situation presents a more troubling picture. The median rent price has seen a relatively large increase, and Florida has the highest share of its renting households that classify as rent burdened in the nation. Louisiana and Mississippi have also seen an increase in rent-burdened households between 2014 and 2015.
Finally, the statewide figures, while a useful high-level indicator of the economic vibrancy of communities, obscure a discrepancy between pockets of persistent poverty and bastions of strong economic growth. Even within rapidly developing cities, there can exist a disparity between a booming downtown and struggling neighborhoods along its periphery. Nevertheless, on the whole, the figures show positive trends for most southeastern states between 2014 and 2015 that appear to have benefited a broad array of communities.
For more information on local economic performance and dynamism in small cities across the Southeast and the rest of the country, check out the Small City Economic Dynamism Index. To track community and economic investments by large foundations that spur economic growth and combat poverty, be sure to use the Atlanta Federal Reserve's new Following the Money interactive data tool. For a deeper dive into longer-term changes in concentrated poverty in neighborhoods and cities across the Southeast, read our recent student paper on Exploring Concentrated Poverty in the Southeast.
By Mels de Zeeuw, Atlanta Fed CED research analyst
_______________________________________
1 This article draws on American Community Survey (ACS) data. Because of the different ways in which various surveys are conducted, the median household income presented here differs from recently released data from the Census Bureau's Current Population Survey, which reported an even greater 5.2 percent increase in national median household incomes between 2014 and 2015. The ACS data are generally considered more accurate for subnational geographies, although its questions on income use rolling 12-month answers, and thus do not provide exact calendar year estimates. The U.S. Census Bureau's "Small Area Income and Poverty Estimates," due to be updated in December, will provide a more precise calendar year subnational picture of income and poverty changes.


