

Editor's note: The data in this article were updated on July 27, 2016, to reflect annual revisions to the U.S. Bureau of Labor Statistics' Characteristics of Minimum Wage Workers.
How many minimum wage workers are there?
In 2015, 3.3 percent of hourly workers age 16 or older earned the minimum wage of $7.25 or less (not including tips). The share of hourly workers paid at or below the federal minimum wage has fallen from highs in the early 1980s and since the last increase in July 2009.
Who works for minimum wage?
Minimum wage workers tend to be young, female, and have lower levels of education. More than half of these workers are in the leisure and hospitality industry, and most work part-time (people who usually work fewer than 35 hours a week).
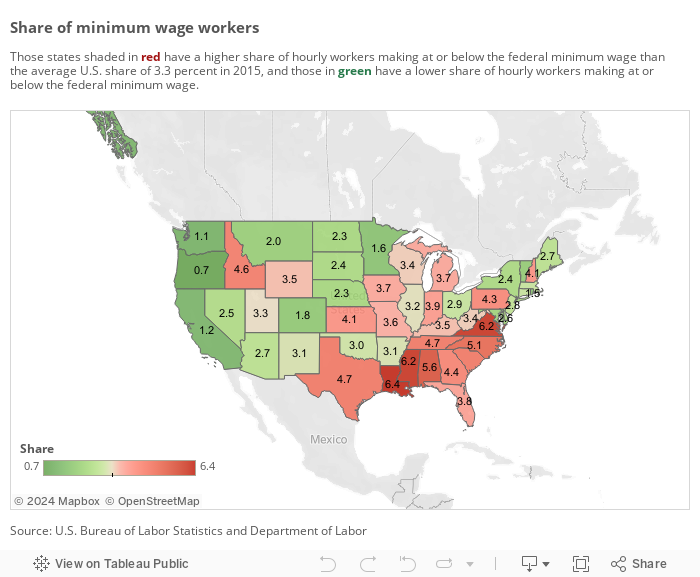
Where do minimum wage workers live?
The map below depicts the concentration of hourly wage workers making at or below the federal minimum wage. We easily see that they are concentrated in the South.
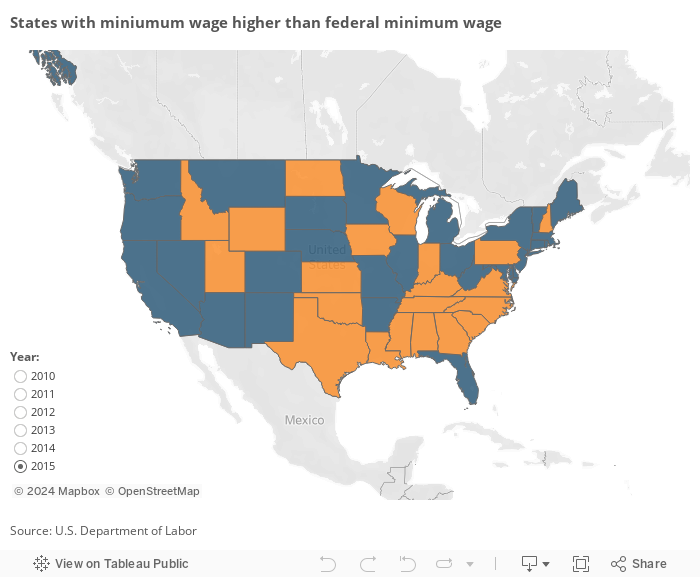
Which states exceed the federal minimum wage?
As noted above, the share of hourly workers making minimum wage or less has declined since 2009, when the federal minimum wage rose to $7.25. During this time, more states adopted a state minimum wage higher than the federal minimum wage, which contributed to the decline in the share of workers making minimum wage or less. As you scroll through the years from 2010 on, you can see as more states adopt a higher minimum wage. (See the Department of Labor’s history of states’ minimum wages.)

Lela Somoza
Financial analyst in the Atlanta Fed's Retail Payments Office

Whitney Mancuso
Senior Economic Research Analyst