
How have states fared since the end of the recession in mid-2009? The U.S. Bureau of Economic Analysis (BEA) recently released its third-quarter 2015 update, which provides some insights into the changing state of state economies based on gross domestic product (GDP).
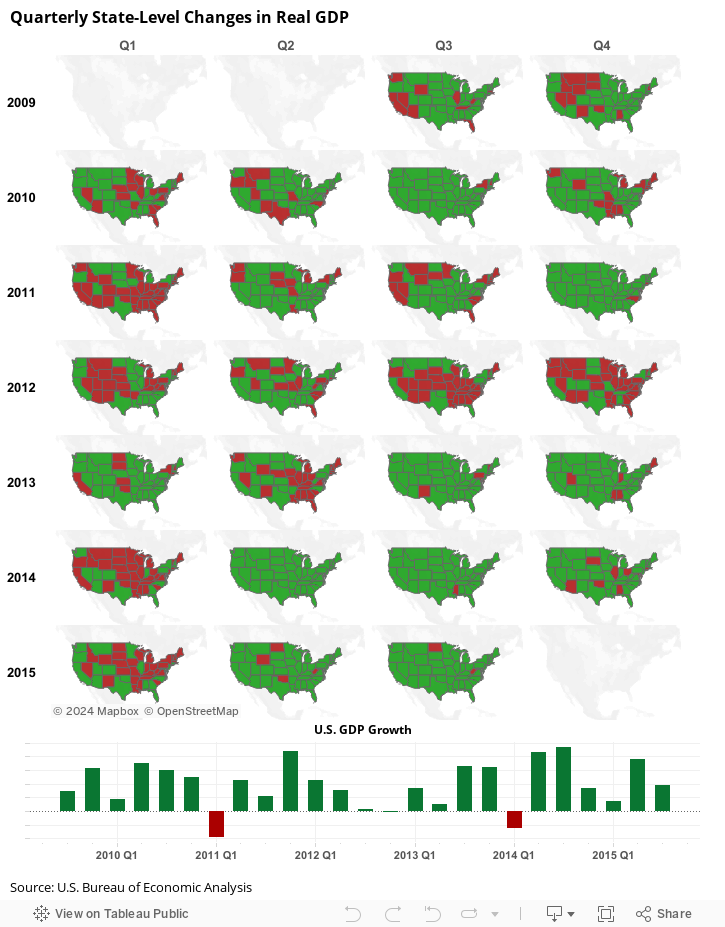
Below is a series of maps of the continental United States. States whose quarterly annualized percent GDP change was negative from the beginning of the expansion in the third quarter of 2009 to the most recent data available in third quarter 2015 are in red, and those that were positive are in green. At the bottom is a chart over the same period depicting U.S. GDP annualized growth as well.
As they did in a fall 2014 macroblog post, the maps depict an uneven recovery. But what is particularly notable is how tough the first quarter of each year has generally been, which translated into weak U.S. GDP; during the first quarters of 2011 and 2014, U.S. GDP was negative. Despite the seasonal adjustment of the data, many have attributed the weakness in some measure to severe winter weather (see this macroblog post and this Chicago Fed Letter).
The state-level negative GDP readings in first quarter may also be partially attributable to severe weather in entire regions of the country. A blizzard that shut down businesses and impeded transportation in a region could hamper a state's economic activity, and warmer-than-usual temperatures could also hurt consumer spending and tourism activity in a region during vacation "high season," significantly affecting output at the state level.
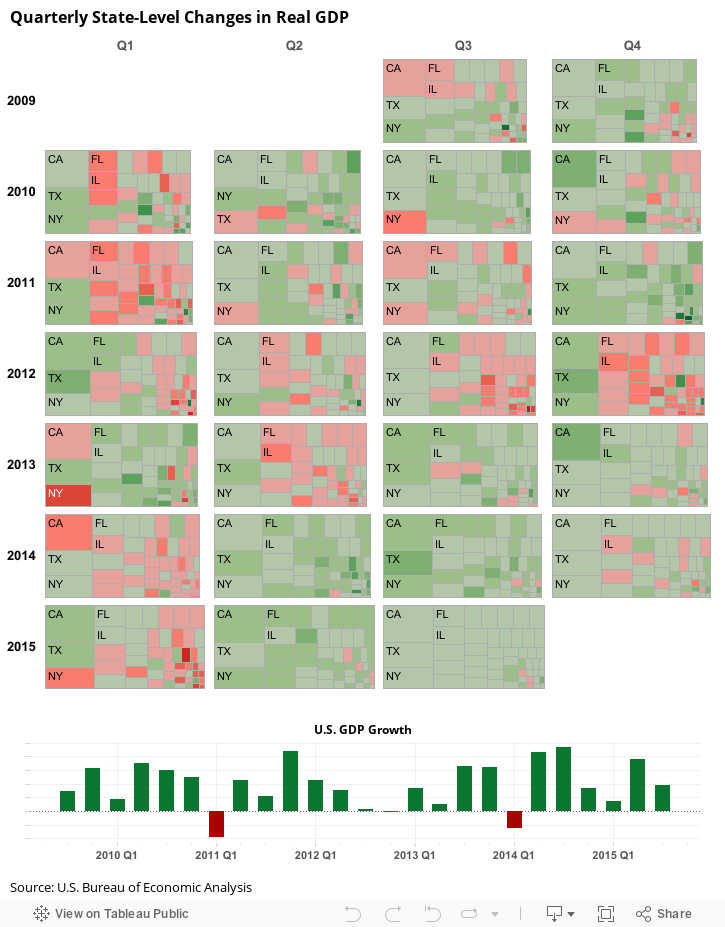
Also notable in the maps is the "redness" of 2012. Still, despite widespread weakness across the United States, this weakness did not result in negative U.S. GDP growth that year. The following tree maps show that during the year, the largest state economies of California, Texas, and New York, which represented about 30 percent of U.S. GDP, maintained positive GDP growth throughout 2012, which offset declines elsewhere.
According to the BEA's latest estimate, U.S. GDP growth slowed to an annual rate of only 1.0 percent in the fourth quarter of 2015. When the BEA releases fourth-quarter state GDP on June 16, it is likely we will see more states shaded in red than in the prior two quarters.

Whitney Mancuso
Senior Economic Research Analyst