
Editor's note: This article is also available in Spanish and Portuguese.
In its February 17 minutes, the Federal Open Market Committee, the policymaking body of the Federal Reserve, noted that "the slowdown in China's industrial sector and the decline in global commodity prices could restrain economic activity in the EMEs [emerging market economies] and other commodity producing countries for some time...moreover, global financial markets could be affected by uncertainty about China's exchange rate regime."
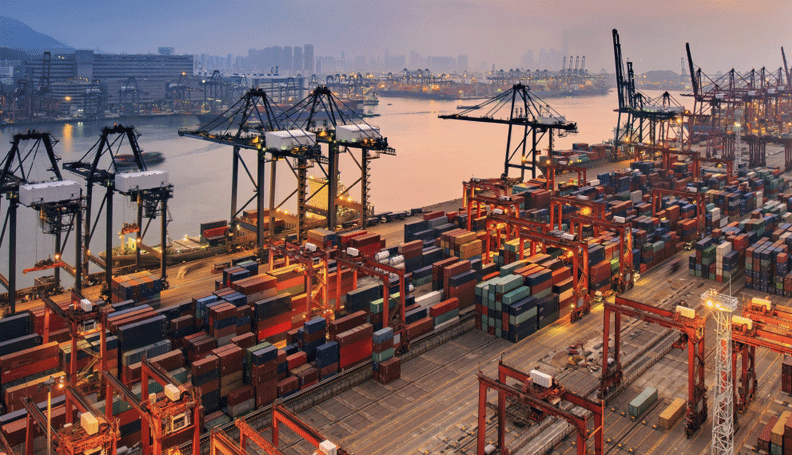
Clearly, China has become a major player in global trade. Continuing the theme of the previous article, "Trade Dynamics and China, Part 1: The United States," this article explores China's global influence by looking at its merchandise trade with the rest of the world. Specifically, the article describes the types of goods that China imports and exports, and the major trading partners in those products. The trade flows are shown for the years 2000, 2003, 2007, 2010, and 2014. The year 2000 is chosen as a decade-change indicator year; 2003 is a couple of years after the entrance of China in the World Trade Organization; 2007 is right before the Great Recession; 2010 is the year following the end of the recession; and 2014 is the last year for which there are sufficient data. Given China's growth as a significant consumer of global oil production, the article gives special attention to China's imports of oil-related products. It also looks at China's trade on a regional basis, and provides a dynamic map of the trade relations between China and the rest of the world on a country-by-country basis.
The final article in this series will examine global trade with both China and the United States, comparing the changes of these trade flows over time.
Imports and exports by products and commodities
The broad mix of the types of products imported and exported by China has changed a lot as its economy has developed. Chart 1 shows the percentage of exports and imports of agricultural, fuels and mining, and manufacturer commodities over the last several decades. Overall, China has become more self-sufficient in terms of agricultural products, but it has increased its demand of oil and minerals used to support its much expanded industrial sector. Specifically, China's imports have shifted away from agricultural products and toward fuel and mining products, with manufactured goods still its major import (manufacturing has been above 60 percent since the eighties). In contrast, China has become much less reliant on exports of agricultural and fuel/mining commodities, with over 90 percent of its exports manufactured goods.1
Looking deeper into the type of commodities traded, charts 2 and 3 provide further details on the product groups (agricultural, fuel mining, and manufacturing) shown in chart 1 for the selected years. For example, the tables show that China's leading exports in 2014 were electrical machinery and equipment (such as computers), machinery and mechanical appliances (such as cellphones), clothing, and metals. Imports of electrical machinery represented one-fifth of China's total imports in 2014, and mineral products made up 16 percent. It is important to emphasize that the type of electrical equipment exported (mainly computers) is not the same as the one imported (mainly storage).
You can view a chart of China's top 10 markets in each of the product categories displayed in charts 2 and 3 by clicking on the category headings in each of the charts.2
Click on a commodity to view its 10 major export countries in 2000, 2003, 2007, 2010, and 2014.
The majority of electrical machinery exports went to Hong Kong, which distributes machinery globally, acting as China's middleman (this has been a consistent pattern over the years). The United States was China's second major export market for electrical equipment, with 16 percent of the total in 2014.
Since 2000, about one-third of China's total exports of machinery went to the United States and Hong Kong combined, and another third to Japan, the Netherlands, Germany, India, the United Kingdom, South Korea, Singapore, and Russia combined.
That United States has been China's major export market for furniture (always above 25 percent for the past 15 years). Japan and Hong Kong have been a large part of China's export market in past decades.
As chart 2D shows, China exports articles of apparel (knitted or crocheted) predominantly to the United States, Japan, and Hong Kong. Japan had long been China's major export market for clothing (about 34 percent of China's total apparel and clothing exports in 2000), but by 2014 the United States almost doubled Japan's share.
One-third of China's exports of articles of apparel and clothing, not knitted or crocheted, come from the top two markets: the United States and Japan.
Almost 50 percent of China's exports of optical photographic and medical instruments goes to the United States, Japan, and Hong Kong. These countries have been the top three export markets of China's since 2000, but their total percentage has been decreasing (more than 60 percent in 2000). (Note that data availability in Comtrade starts in 2000.)
In 2014, China exported plastic products mainly to the United States, about one-fifth of China's total exports of plastic and plastic-related items that year. The remaining nine out of top 10 countries in the chart comprised one-third of China's total exports of plastic in 2014. The top export markets of plastic have been relatively consistent over the years, with the United States on top of the list since around 2000.
The United States represented 16 percent of China's total exports of vehicles in 2014, while the nine other major export markets shared one-third of the remaining pie.
More than 77 percent of the total exports of natural and precious stones for each year went to the United States and Hong Kong only.
In 2000, the top 10 export markets for iron and steel represented 70 percent of its total exports, but their proportion slowly decreased to 44 percent by 2014. The United States is again leading the export market for China.
Click on a commodity to view its 10 major import countries in 2000, 2003, 2007, 2010, and 2014.
Chart 3A shows China's major import partners for electrical equipment in 2014. A large proportion of those imports came from Asia (about 71 percent in 2014); 20 percent came from the United States, Germany, the Philippines, Singapore, Vietnam, and Thailand.
Chart 3B shows China's main source of imported fuel products. They are generally sourced from the Middle East, Africa, and Russia, although the primary source varies over time.
Chart 3C shows China's top 10 imports and export markets for machinery since 2000. Approximately 60 percent of China's total imports of machinery came from Japan, Germany, South Korea, and the United States in 2014.
The majority of import markets for ores, slag, and ash are emerging markets and neighbor countries, including Australia, Brazil, India, Chile, and the Philippines. Australia has been the major importer of ores, slag, and ash from China.
The major import markets of optical, photographic, cinematographic, and other items are Asian countries. United States was a large proportion of China's imports of this good, but this percentage has decreased over the decades, to 12 percent in 2014.
It is not surprising that a large percentage of vehicles imported by China over the years came from Germany, Japan, and the United States, all major carmakers. China's imports of vehicles from Japan have been decreasing, going from 33 percent in 2003 and 2007 to less than 20 percent in 2014.
In 2014, China imported the majority of its plastic from neighboring countries in Asia.
Since 2000, Japan and South Korea have been the two major import markets for organic chemicals. In 2014, they represented 40 percent of the whole organic chemical market.
Since 2000, Chile has been the top source of China's imports of copper (approximately 20 percent). In 2014, Japan, Australia, and the United States together represented about 20 percent of China's import market for this specific good.
Over the years United States, Brazil, Canada and Argentina have been the top four import markets of China for seeds (controlling more than 70 percent of the import market since 2000). In 2014 these countries combined represented approximately 92 percent of China's total imports of seeds.
China's consumption and production of oil
China's appetite for crude oil has increased over time. In 2014, China's consumption was greater than that in the Middle East, Africa, and Central and South America. However, U.S. oil consumption was still considerably higher than China's consumption. China contributes 5 percent of world oil production, which is half the total oil production of Asia. The Middle East was still the main producer of oil in 2014 (32 percent of total global production), followed by North America (21 percent), and Europe and Eurasia (19 percent).
Chart 4 shows the ratio of oil consumed to oil produced for several selected economic regions, the United States, and China in 2014. When the ratio calculated is less than one, it means that the country of interest is producing more than it consumes; as it reaches one, the oil consumed and produced is the same; and when it is greater than one, the country or region consumes more than it produces. According to the chart, Asian countries and China were consuming more than double their own production of oil. The United States and Europe were also consuming more oil than they produced, but not as much as Asia was. Not surprisingly, Middle Eastern and African countries were producing much more oil than their domestic need, while Central and South America countries were consuming 90 percent of their total oil production.
Imports and exports by regions
Thanks to tariff reforms implemented in the eighties as well as China's accession to the World Trade Organization (WTO) in 2001, goods and services now move more freely across China's borders. Once it became a WTO member, China expanded its exports to new markets while diversifying its imports from all regions. China has also expanded its central role as a trade partner for most of its neighboring countries and emerging markets.
Chart 5 shows various economic regions' shares in China's total exports over the decades. By looking at the seven regions and subregions listed in the chart, China exports mainly to advanced economies3 even if their bilateral trade has been decreasing over the years (from 73 percent in 1980 to 65 percent in 2014). Emerging-market and developing countries4 are China's second-largest export market (13 percent of China's total exports in 2014). Europe and Middle East exports remained constant over the decades, while Sub-Saharan and Western Hemisphere exports have increased slightly since the 1980s.
Similarly, chart 6 shows China imports by selected regions over the decades. China's imports from advanced economies (such as Europe) have decreased over time to be 56 percent of China's total imports in 2014. China has been increasing its imports from all other regions, particularly from emerging-market and developing countries and developing Asia, which represented 44 percent of total imports in 2014. Advanced economies as a group are still China's single largest source of imports.
China and imports and exports from countries globally
Over the decades, the United States went from being one of the top three major export markets of China to being number one: 5.4 percent of total China exports went to the United States in the 1980s, and that figure climbed to almost 17 percent in 2014. In contrast, Japan's share in China trade has decreased over the decades, from 22.2 percent in 1980 to 6.4 percent in 2014. Despite that decline, Japan is still China's third major export partner. Hong Kong's percentage of China's total trade has been steadily decreasing since the 1980s, but it still represents a large proportion of Chinese exports. About 8 percent of China's export trade goes to Germany, the Netherlands, and the United Kingdom combined, which are the European countries on the list of the top 10 China export partners. It is important to stress that European countries have a free trade agreement among themselves; indeed, goods that travel to any European Union (EU) country can be redistributed among other EU members.
China exports to South Korea three times as much as it does to Vietnam, India, Russia, Singapore, Malaysia, and Taiwan. Approximately 1 percent of Chinese exports are sent to each of the following countries: Australia, Indonesia, United Arab Emirates, Brazil, Mexico, Canada, France, Iran, the Philippines, and Italy. In 2014, the top 25 export markets of China received at least 1 percent of China's total exports, while the rest of the world combined represented less than 20 percent of China's total exports. In contrast, in the 1980s, the first 15 countries constituted more than 80 percent of the Chinese export trade. Map 1 shows a dynamic view of the share of China's exports to each country, calculated as a percentage of China's global exports for each of several selected years (1980, 1990, 2000, 2003, 2007, 2010, and 2014).
From the import perspective, China imported 60 percent of its total imports from 10 major partners in 2014: South Korea, Japan, the United States, Taiwan, Germany, Australia, Malaysia, Brazil, Saudi Arabia, and South Africa. China imported from Japan and South Korea about 9 percent of its total imports in 2014. Back in 1980, Japan accounted for one-quarter of China's imports, and South Korea ranked just 59th on the list of China's trading partners, measured by goods imports. The United States has long been one of China's top five suppliers of imports, even as its share has decreased from 19.8 percent in the eighties to 7.9 percent in 2014. Germany and Australia have also ranked high on the list, while China's share of imports from Brazil and Saudi Arabia has increased almost eight times since the eighties.
China received 22 percent of total imports cumulatively from the following countries in 2014: Russia, Switzerland, Thailand, Angola, Singapore, Iran, France, Indonesia, Oman, the United Kingdom, Canada, Chile, the Philippines, Iraq, Vietnam, and Italy. In the eighties, just 14 countries accounted for 84 percent of China's total imports. The strong increase in the number of markets from which China imports its merchandise could be evidence that China is penetrating a continuously larger pool of diversified markets. Map 2 shows a dynamic view of the share of China's imports from each country, calculated as a percentage of China's global imports for each of several selected years (1980, 1990, 2000, 2003, 2007, 2010, and 2014).
Conclusion
This article explored the trade dynamics between China and the rest of the world, in terms of China's merchandise exports and imports. Clearly, a lot has changed since the eighties when China imported mainly agricultural products and exported some manufactured goods. Today, China imports a large amount of fuels and mining commodities, and almost exclusively exports manufactured goods. China's oil consumption has grown significantly over the last several decades, and in 2014 it was the world's second-largest oil consumer, importing oil products primarily from the Middle East, Africa, and Russia.
The advanced economies, as a group, are China's largest trading partner. But since the eighties, as China has expanded its overall share of global trade, China's trade has become increasingly diversified across regions.
The final article in this series will look at trade flows between China and the rest of the world, comparing it with the trade flows of the United States. How have these trade patterns changed over time and across what types of goods? Look for the answers in the next article.
1 A large proportion of imports are re-imported from China, but re-imports from China are subtracted from the share's calculation. Re-imports are goods produced in China that come back or leave China without being modified or transformed. Often re-imported goods come from Hong Kong.
2 Comtrade uses "Other Asia" as a partner (a) for low-trade values in Asia; (b) if the partner was unknown to the reporting country but the region was clear; (c) because of measurement errors; (d) the reporting country did not specify the trading partners but only the region. "Other Asia" represents a large proportion of China's trade, so it cannot be ignored.
3 Including the United States, the euro area, Japan, the United Kingdom, and Canada.
4 Including Russia, developing Asia (China, India, ASEAN-5), developing Europe, Latin America and the Caribbean, the Middle East, North Africa, Afghanistan, Pakistan, and Sub-Saharan Africa.