

 The Cyclical Recovery
In the complex U.S. economy, trends do not often fit cleanly into categories such as cyclical and secular. Broadly speaking, though, it is possible to classify certain developments as mainly cyclical and others as more persistent, or secular.
As the video explained, we have experienced a cyclical economic recovery. Let's delve deeper into cyclical elements of the economy that have, by and large, rebounded.
Macroeconomy
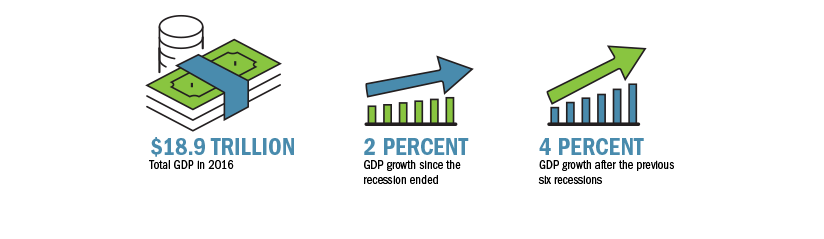
Annual GDP growth is a sort of speedometer for the nation's economy.
Start with the broadest gauge of the nation's entire economy. Gross domestic product, or GDP, is a monetary measure of the value of all final goods and services produced. In 2016, GDP in the United States totaled roughly $18.9 trillion, according to the U.S. Bureau of Economic Analysis. Another important macroeconomic indicator is inflation, which has been below the central bank's 2 percent target throughout the recovery.
Congress established the Federal Reserve's monetary policy objectives of maximum employment and stable prices in the Federal Reserve Act. These legislated objectives are often referred to as the "dual mandate."
Note that in charts, gray bars indicate recessions.
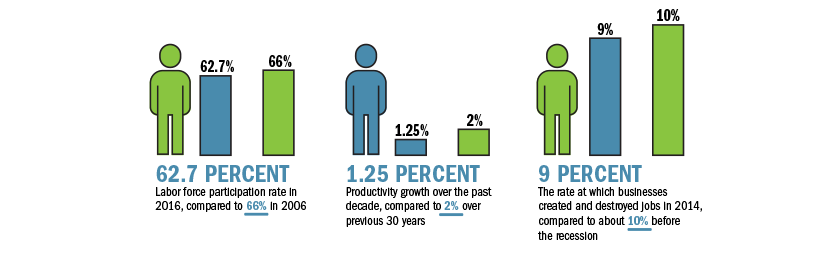
Labor Market
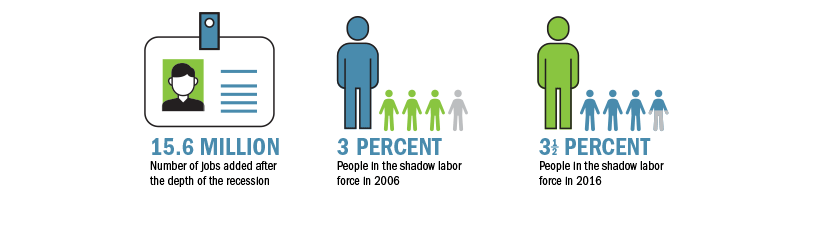
The labor market: More of us are working than ever.
Businesses have been hiring at a solid pace despite tepid growth in output. Consequently, aggregate employment has staged a reasonably robust cyclical recovery from a bruising downturn.
Note that in charts, gray bars indicate recessions.
Consumer Finances
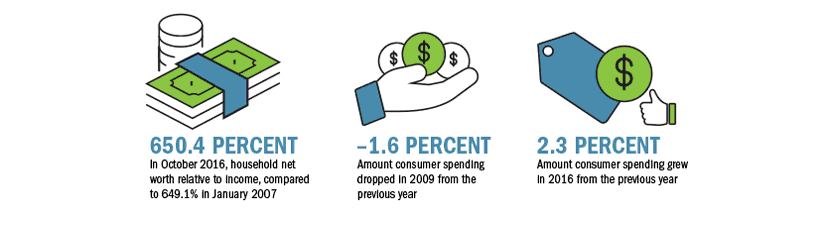
Consumers' finances are much healthier.
Consumer spending is the largest single component of GDP, so the health of the consumer sector is crucial to the health of the overall economy. Several broad measures of consumers' financial well-being and spending describe a cyclical recovery.
Note that in charts, gray bars indicate recessions.
Housing
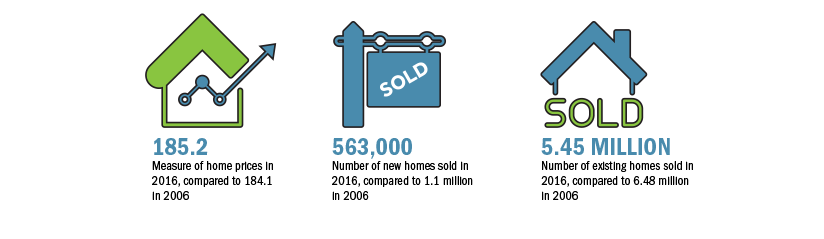
The residential real estate market is vital to the economy, even though new residential construction accounts for only about 3 percent of GDP. For homeowners, purchasing a home is usually their largest single financial transaction, and their homes may become their most valuable holding. In fact, residential real estate accounts for about 70 percent of the value of all household nonfinancial assets. The real estate sector also supports hundreds of thousands of construction jobs, as well as employment for those selling homes, making home loans, and producing and selling housing-related goods and services.
Note that in charts, gray bars indicate recessions.
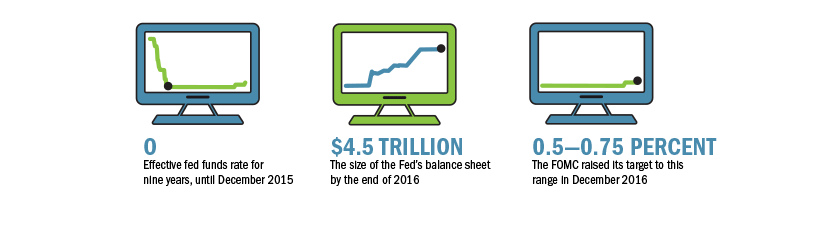
 Monetary Policy
Monetary policy was the primary public policy tool deployed during much of the recovery, and it likely supported the cyclical rebound. Even though the economy has returned to a healthier state, by historical standards, monetary policy remains accommodative—interest rates are low. That's largely because of the secular factors restraining the recovery.
Note that in charts, gray bars indicate recessions.
 Secular Trends
Beneath the cyclical healing lie stubborn forces that have not been much influenced by monetary policy, and probably won't be. Addressing these issues is likely up to federal and state legislative bodies, along with the private sector.
Note that in charts, gray bars indicate recessions.
 Headwinds
Unexpected headwinds keep interfering with steady growth.
Unpredictable events can sow uncertainty that can restrict hiring and capital spending. Events that generate policy uncertainty "foreshadow declines in investment, output, and employment," economists Scott R. Baker, Nicholas Bloom, and Steven J. Davis write in a March 2016 paper. That trio maintains an index measuring economic policy uncertainty.
Of course, unpredicted events didn't start in the past decade. But the index of policy uncertainty has drifted upward since the 1960s, Baker, Bloom, and Davis write. And since 2007, policymakers have faced seemingly unrelenting waves of uncertainty. Consequently, says Dennis Lockhart, Atlanta Fed president from early 2007 until the end of February 2017, "It's very difficult, in real time, to know exactly where the economy is."
Note that in charts, gray bars indicate recessions.
A windy decade
An extraordinary increase in house prices and mortgage debt partially set the stage for the financial crisis. From 1998 to 2006, average U.S. home prices more than doubled, while home mortgage debt rose from the equivalent of 61 percent of GDP to 97 percent of GDP.
Scroll through the decade-long timeline to view some of the unexpected events that likely influenced the economic recovery.


JULY 2007
Bear Stearns liquidates mortgage-backed securities hedge funds
AUGUST 2007
Interbank credit markets freeze
OCTOBER 2007
Citigroup writes down subprime mortgage losses
FEBRUARY 2008
Economic Stimulus Act signed
MARCH 2008
Bear Stearns collapses, bought by JPMorgan Chase
SEPTEMBER 2008
Fannie Mae, Freddie Mac go into government conservatorship
SEPTEMBER 2008
Lehman Brothers collapses; largest bankruptcy in U.S. history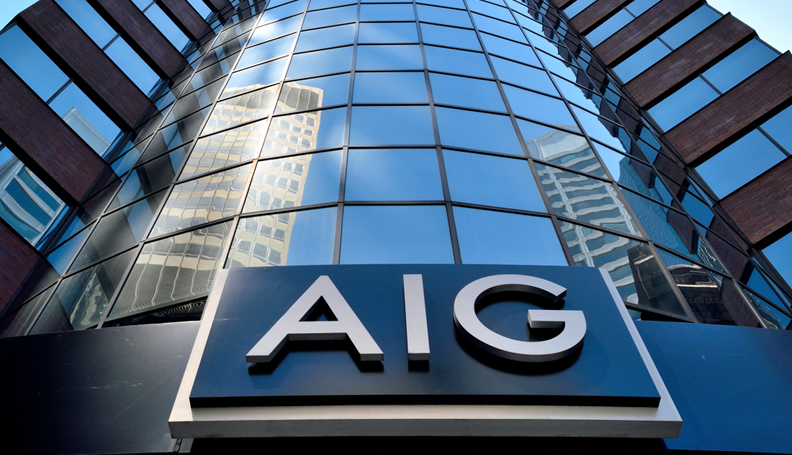
SEPTEMBER 2008
AIG Group accepts $85 billion federal loan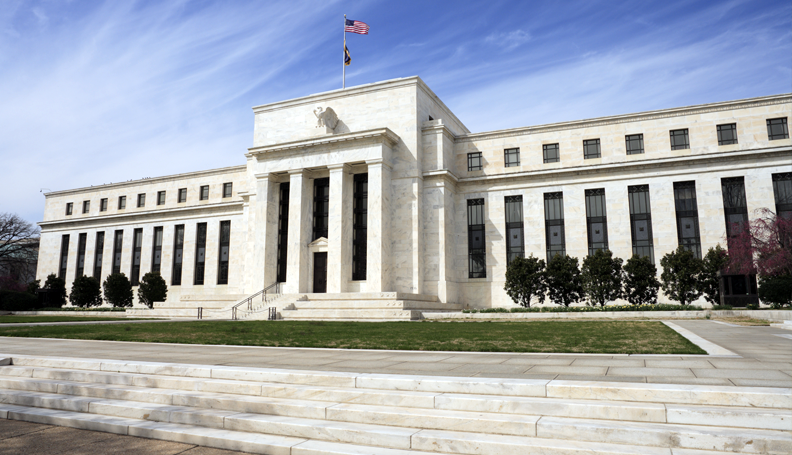
DECEMBER 2008
FOMC cuts fed funds rate target to 0–0.25%
JANUARY 2009
FOMC says Fed will buy long-term Treasury securities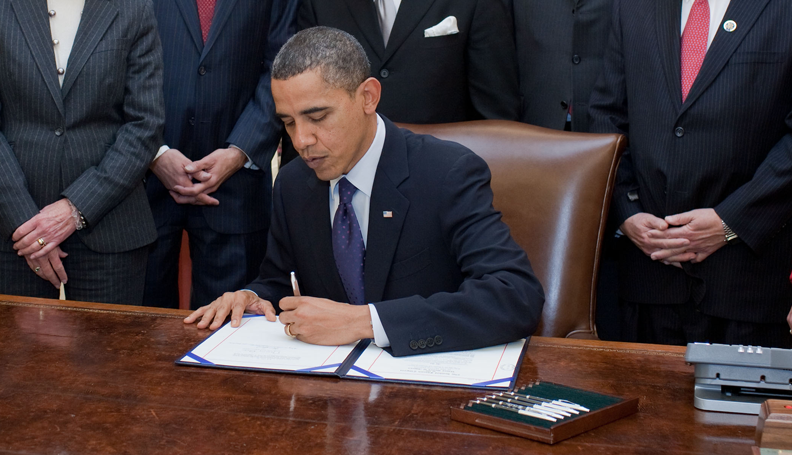
FEBRUARY 2009
President Obama signs $787 billion stimulus package
OCTOBER 2009
Unemployment peaks at 10%
LATE 2009
European debt crisis intensifies
MARCH 2010
Affordable Care Act becomes law
APRIL 2010
Greek debt crisis deepens
JULY 2010
Dodd-Frank Wall Street Reform and Consumer Protection Act was signed into federal law
DECEMBER 2010
Congress approves $860 billion tax cut, extended unemployment insurance
JANUARY 2011
Arab Spring protests spread
MARCH 2011
Massive earthquake, tsunami in Japan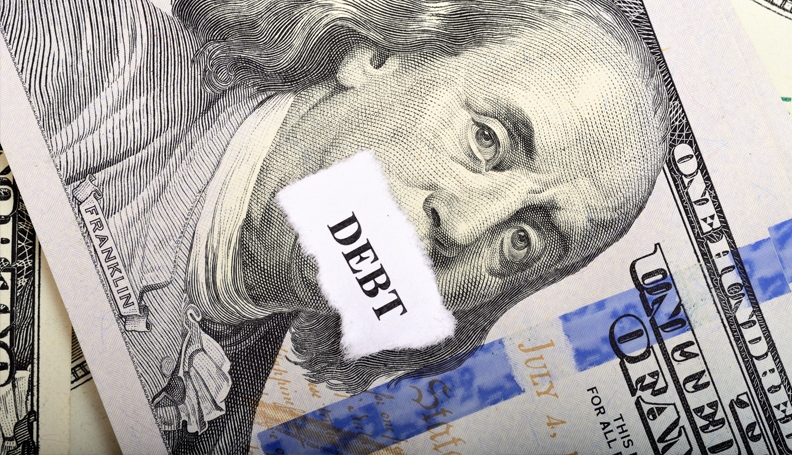
JULY 2011
Debt ceiling crisis threatens U.S. government debt default
AUGUST 2011
Budget Control Act avoids default, brings big cuts
DECEMBER 2011
China's economic growth slowed through 2011
OCTOBER 2012
Superstorm Sandy strikes New Jersey, New York; second costliest U.S. hurricane ever
NOVEMBER 2012
Euro zone economy falls back into recession
DECEMBER 2012
U.S. government approaches "fiscal cliff"
MARCH 2013
Automatic spending cuts begin (sequestration)
JULY 2013
Detroit files nation's largest public sector bankruptcy
OCTOBER 2013
U.S. government shuts down for 16 days
OCTOBER 2013
Affordable Care Act goes live
DECEMBER 2013
Fed begins reducing asset purchases
JULY 2014
Crude oil prices fall sharply
AUGUST 2014
Police shootings, demonstrations roil U.S.
OCTOBER 2014
Fed announces end of quantitative easing
AUGUST 2015
Worries about Chinese economy send Dow down over 1,000 points in a day
NOVEMBER 2015
Terrorists carry out attack in Paris
DECEMBER 2015
FOMC raises rate target to 0.25–0.50%
JUNE 2016
United Kingdom votes to leave European Union
NOVEMBER 2016
Bitter U.S. presidential election