

Asset Quality
The asset quality environment continues to perform well, with concerns about the credit cycle diminishing slightly during the quarter. Third quarter results show that noncurrent loans remain at low postcrisis levels, with the amount of loans past due 90 days or more declining from the prior year. Loans past due 90 days or more at community banks in the Sixth District have remained below 1 percent for nearly three years. New nonaccruals added during the quarter were less than 1 percent of net loans on a median basis, (which rounded to 0.00% in the chart below).
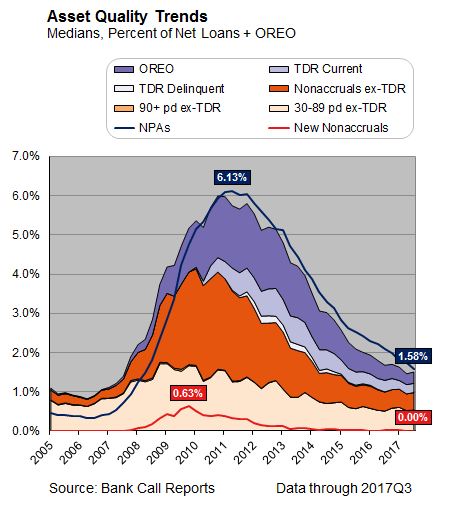
Net charge-offs, as a percentage of average loans, were 0.07 percent in the third quarter of 2017, a slight increase over the prior quarter, but the allowance for loan losses coverage ratio remains above 100 percent. Natural disasters are expected to have a short-term impact on economies across the South and potentially on asset quality. In parts of the Sixth District affected by Hurricane Irma, banks were in good financial condition before the storm and are expected to withstand the storm’s effects. Research on prior natural disasters has shown that seriously delinquent loans can spike, but the spikes typically have a short duration. Credit metrics for commercial banks in Florida had been improving prior to the storm, with nonaccruals declining year over year. In reporting third quarter data in the Call Report, nonaccrual and other real estate owned continued to decline in commercial banks in Florida. Long-term credit issues in the market will be more likely tied to the agriculture industry, though the storms effects are likely to last beyond the current season. Some banks reported a small increase in the allowance for loan losses in anticipation of lower sales from harvests and fewer farming jobs at the end of the season. The state has an estimated one million jobs associated with agriculture, making up one of largest expenditures for farm producers in Florida. With an inability to work, many displaced workers could face a reduction in income as the agriculture industry recovers.
Balance Sheet Growth
Annualized balance sheet growth was just under 3.5 percent, on a median basis, in the third quarter. Growth in securities portfolio remains positive, after being negative for most of 2016, as banks add higher-yielding bonds. The loan portfolio is the banks' largest asset class on the balance sheet and a key driver of bank growth and earnings. Loan growth started to slow among Sixth District community banks in the third quarter, with some banks' loan growth turning sharply negative (see the chart). On a median basis, loan growth was 6.2 percent and was concentrated in the largest community banks.
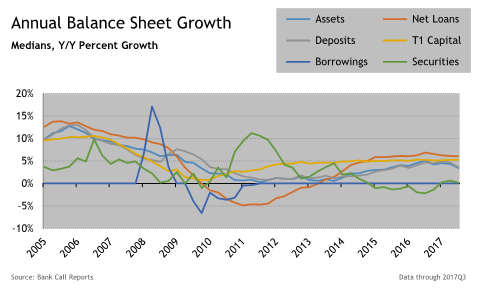
Construction and development (C&D) remains the highest-growth portfolio, while consumer loan growth was barely positive on a median basis. Residential construction is driving growth in the C&D portfolio. Home values have grown steadily, surpassing precrisis levels in a number of markets across the nation, driven by higher building costs, limited inventory, and higher demand. Builders have been willing to explore new sites to allay some of the building costs, although the lack of skilled labor is adding significant cost to a number of construction projects. Lending for multifamily projects has slowed in recent quarters over concerns about the level of supply in the development pipeline.
Growth in the C&I loan portfolio started slowing at the end of 2016 and has continued dropping through the first three quarters of 2017 to just over 6.5 percent. The slowdown appears to be as much from a lack of demand from small businesses as a pullback by banks.
Growth in the CRE portfolio increased slightly from the prior three quarters. CRE concentration levels have drifted upward to the point that the median level for all banks is approaching precrisis levels. Banks have gotten more selective in extending financing for nonresidential properties, especially new retail property developments. CoStar estimates that more than 10 percent of retail space (nearly one billion square feet) may need to close or convert to other uses. In the wake of those concerns, indications exist that some banks are walking away from retail property loans because of the shift to e-commerce. Increasingly, the CMBS market is becoming the lender of last resort for retail projects. On an aggregate basis, consumer loan growth remains negative.
Banks reported in the latest Senior Lending Officer Opinion Survey a couple of reasons for the decline, among them tighter underwriting standards and shrinking demand. Banks expressed concern in the survey about a more uncertain economic outlook, as well as an expected deterioration in the quality of their existing loan portfolio as reasons for tighter underwriting standards. In addition, for auto loans in particular, banks also suggested that concern over declining collateral values on its auto portfolio was an important reason for tightening standards. Banks also reported that demand for consumer products from prime customers has weakened because of increasing interest rates.
Capital
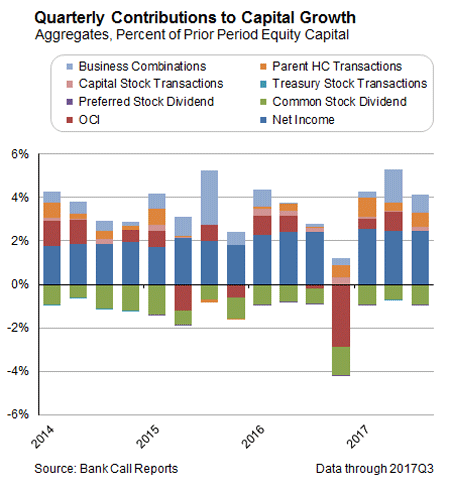
Improved profitability, slower loan growth, and repositioned securities portfolio have helped keep capital levels stable during the third quarter for community banks in the Sixth District. The median tier 1 common capital remains above 15 percent with almost no variation over the last five years. Risk weighted assets growth continues to be below 2 percent (see the chart).
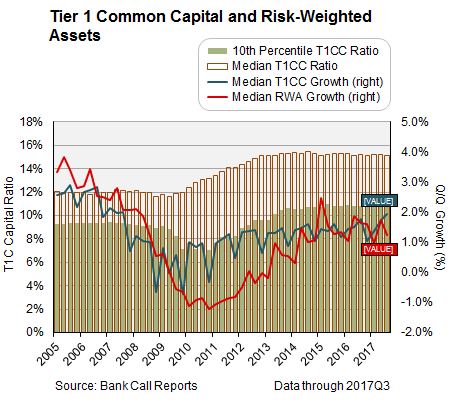
While dividend payout ratios have remained consistent for the past two years, business combinations have had an increasingly positive affect on total capital as assets are revalued in the merger transactions. Improving earnings has allowed capital to outpace the growth in risk weighted assets (see the chart).
Several changes have either been proposed or have been finalized that could affect capital ratios during the next two years. One finalized change is the Financial Accounting Standards Board’s new lease accounting guidance, which will place operating leases on the balance sheet with an offsetting liability. The new standard could lower capital ratios, but the impact is not expected to be significant. Additionally, the agencies propose to replace the current treatment of high volatility commercial real estate (HVCRE) with a more straightforward treatment for acquisition, development, and construction loans. Banks have struggled with HVCRE rules since the rules became effective. In the first year after the rules became effective, only half the banks surveyed reported having outstanding loans classified as HVCRE, which was lower than what the banking agencies expected. An early analysis of the agencies’ proposal concluded that the change in HVCRE would make the rules easier to interpret while increasing the number of loans held at a higher risk weight.
Earnings Performance
Activity at community banks in the Sixth District appeared to slow in the third quarter, with demand for loans declining and deposit growth slowing. Still, return on average assets (ROAA) increased 6 basis points (bps) year over year among Sixth District banks in the third quarter, increasing to 1.02 percent on a median basis (see the chart).
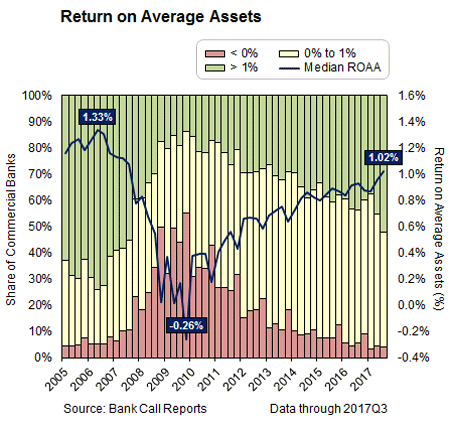
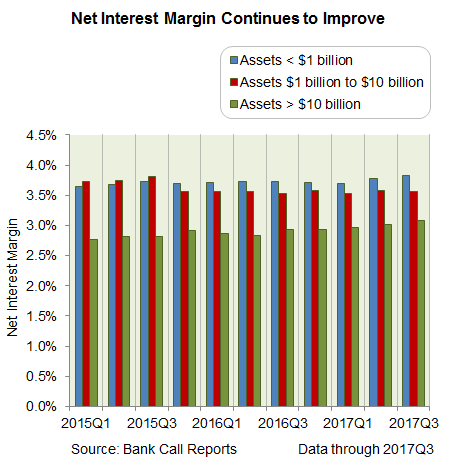
Regional banks fared slightly better than their smaller counterparts. Banks with assets between $1 billion and $10 billion had the largest gains in earnings. More than half of the banks now have ROAAs above 1 percent for the first time in a decade. The improvement in earnings was primarily because of an improving net interest margin (NIM) (see the chart).
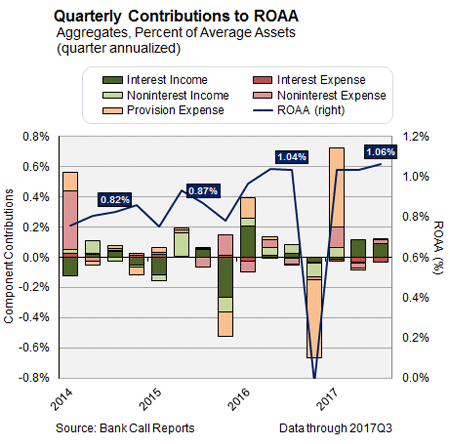
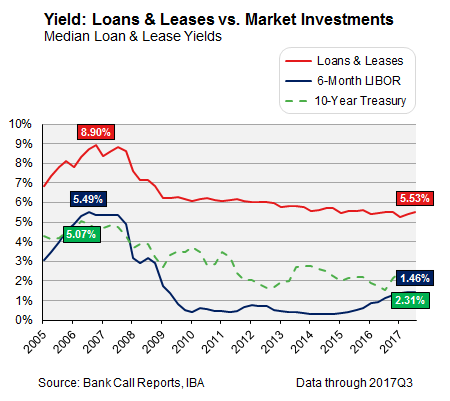
In the third quarter, NIM was 3.98 percent, the highest NIM reported since the fourth quarter of 2007. Consistent with their national counterparts, NIM at banks in the District benefited from the recent changes in interest rates. Treasury rates on the 10-year bond increased in the third quarter and are nearly 80 bps higher year over year. Even though interest rates were expected to rise this year, that increase hasn't occurred. Although mortgage rates have inched up, it hasn't been a drastic increase. Even with the slow increase in rates, the loan yield pushed upwards 10 bps over the prior quarter putting the yield on par with the prior year (see the chart).
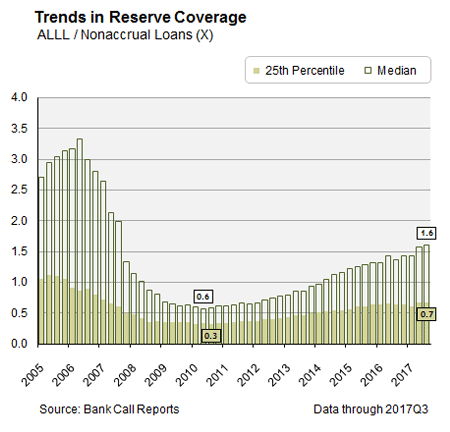
Changes in interest rates are also putting upward pressure on interest expense as more depositors are starting to expect some return. Banks had hoped to delay increasing rates, but competition for deposits, especially from large banks, is growing. Noninterest income, as a percentage of total revenue, increased slightly as loan growth slowed the impact on some origination fees. Banks had placed a greater emphasis on expanding noninterest income during the early part of the recovery, but they were unable generate a significant growth in fees. Provision expense increased slightly during the quarter, which improved the coverage ratio of allowance for loan losses to nonaccrual loans to 1.6 on a median basis, over 100 bps higher than the low point in mid-2010 (see the chart).
Higher revenues have helped improve the efficiency ratio. On a median basis, the efficiency ratio improved by 200 bps over the prior year and was just over 60 percent in the third quarter.
Liquidity
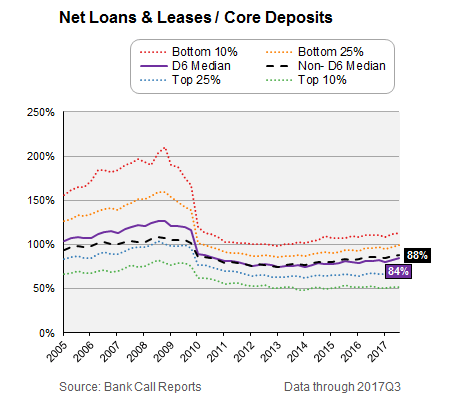
As the banking recovery continues, banks are increasing the attention given to liquidity as they plan for growth. Liquidity on hand, as a percentage of total liabilities, declined slightly during the quarter. Changes in deposits, as interest rates start to rise, have slowly affected liquidity in the Sixth District, though the level of deposits is still higher than prior to the crisis. The median loans-to-core deposits ratio remains favorable, but at 84 percent, it's at the highest level since deposits started pouring into banks after the Federal Deposit Insurance Corporation's (FDIC) insurance limit was increased to $250,000 (see the chart).
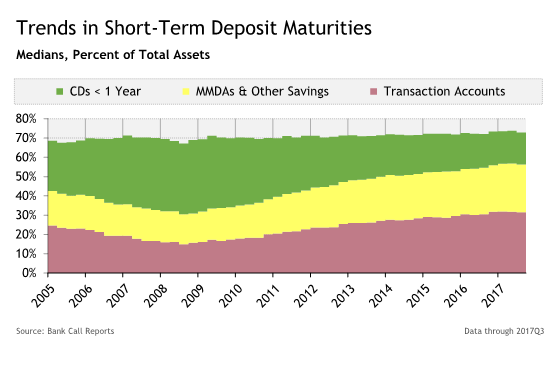
Before the recent increases in the fed funds rate, smaller banks in the Sixth District had deposits shift more toward transactional accounts than interest-bearing accounts than was the historical norm (see the chart).
Should interest rates continue to rise and normalize, it's expected that more customers will shift their deposits from lower-yielding products to higher-yielding financial products, especially if banks fail to competitively price their interest-bearing products. The ratio between loans and core deposits has changed little since the crisis, but some banks are considering using more wholesale funding in their loan growth strategies. Net noncore dependence increased over the last two quarters and was at its highest level in two years at 2.26 percent at the end of the third quarter. Early in the third quarter, the FDIC expressed concern over the level, seeing a return to relying on noncore funding to fuel loan growth.
National Banking Trends
Economic conditions continued to prove favorable for banks in the third quarter. Return on average assets (ROAA) improved for the smallest community banks with assets below $1 billion in the third quarter on an aggregate basis. Larger banks experienced a slight dip in their ROAA, primarily because of a decline in noninterest income. With the recent increases in interest rates over the past 12 months, the net interest margin (NIM) for banks has reached its highest level in over two years (see the chart).
Indications are that interest rates could increase again late in the year, which would further improve margins going into early 2018. In terms of managing noninterest expenses, the efficiency ratio remained unchanged from the prior quarter on an aggregate basis, although smaller community banks experienced their largest improvement in the ratio in three years.
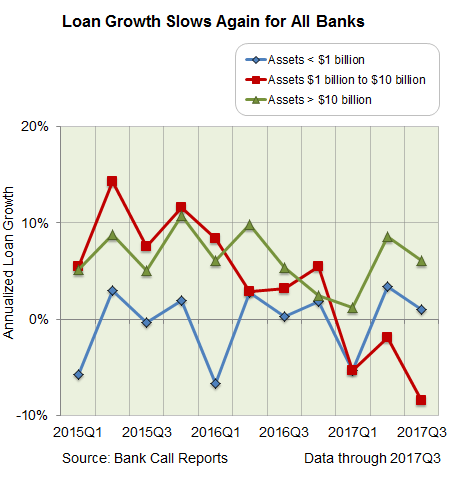
Although the margin at most banks is improving, loan growth has slowed for the large banks, particularly in commercial and industrial (C&I) and commercial real estate (CRE) (see the chart).
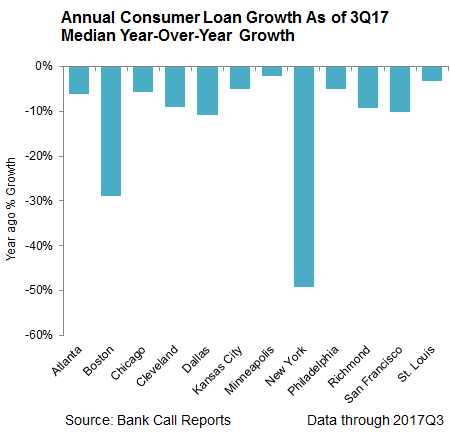
The slowdown in growth appears to be demand related. Large banks have become more interested in small business lending as interest rates continue to increase. Banks have also been more wary about increasing their CRE concentration and are closely managing their current exposure. Consumer loan growth, on an annualized median basis, has turned negative across all Federal Reserve districts in the third quarter (see the chart).
Auto, credit card, and personal loan debt have pushed consumers' debt to historic levels, and banks are reconsidering pushing out loan terms over longer terms. Residential loan growth has held steady at community banks, and growth has slowed at large banks. New home buyers had difficulty finding homes to purchase because of a lack of inventory and increasing prices.
Despite the positive economic conditions in recent quarters, the ratio between loans and core deposits has been little changed since the crisis. However, some banks are considering using more wholesale funding in their loan growth strategies. One reason is that as interest rates start to increase, deposit growth is starting to slide. Deposit growth rates at most banks have fallen back to early 2008 levels.
Third quarter Call Report data show that noncurrent loans remain at their low post crisis levels, with amount of loans past due 90 or more days declining from the prior year. Changes in the interest rates, as well as problems with affordability, appear to have led to some loosening of underwriting standards for residential loans as the number of homebuyers with an loan-to-values (LTV) greater than or equal to 95 percent increased significantly in recent months.