
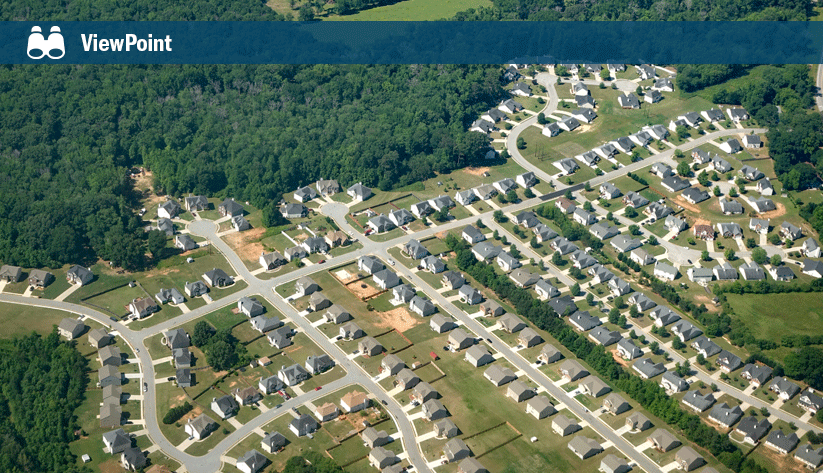
Job creation—particularly in major cities—is one of the biggest drivers of residential real estate, attracting individuals and families to a new area. Over the past seven years, the United States has created an average of 200,000 new jobs a month. During that same time, the states in the Atlanta Fed's district—Alabama, Florida, Georgia, Louisiana, Mississippi, and Tennessee—created a net average of 33,300 total jobs a month, and metro areas have also seen employment growth (see the chart).
In July 2010, the first month to see a net gain in jobs in the region after the downturn, the unemployment rate for the Sixth District hung at 9.1 percent. Since then, the region's unemployment rate has declined steadily. In March 2018, it fell to 4 percent, just below the national unemployment rate, according to the U.S. Bureau of Labor Statistics.
As of March 2018, the top four industries in the District with the strongest year-over-year net new job growth were, in order, leisure and hospitality, education and health care, construction, and professional and business services. Employment in these industries, with the exception of construction, is an average of 14.5 percent higher than it was at the height of the expansion. Construction sector jobs remain 17 percent below the prerecession peak, though that peak rate in construction employment was not truly sustainable. To put this change in perspective, the deepest part of the recession (late 2010 to early 2011) saw construction employment that was 56 percent below peak. In seven years, the industry's employment has recovered 39 percent from its lowest point, a definite sign of this recovery's strength in certain sectors.
The table breaks down the month-over-month and year-over-year statewide employment growth and unemployment rate for each of the six states in the District as of March 2018. Unemployment rates match, and in some cases dip below, the national unemployment rate, and job growth has remained healthy.
|
State |
Employment growth |
Year-over-year employment growth |
Unemployment rate |
|
Alabama |
3,100 |
19,300 |
3.8% |
|
Florida |
13,800 |
173,100 |
3.9% |
|
Georgia |
-7,400 |
65,200 |
4.4% |
|
Louisiana |
6,800 |
12,100 |
4.4% |
|
Mississippi |
1,000 |
14,400 |
4.5% |
|
Tennessee |
4,900 |
49,000 |
3.4% |
Note: Unemployment rate data are seasonally adjusted.
Source: U.S. Bureau of Labor Statistics
Population growth, aging drive demand
Other factors driving residential housing demand are net in-migration and population growth. In 2017, the District's states have seen a net positive migration (domestic and international) of over 118,000 people. Net population growth for the District reached 512,000 in 2017. The table shows a breakdown of these numbers by state.
|
State |
Total net migration |
Year-over-year population change in 2017 (percent) |
Percent of residents age 65 or older in 2016 |
Percent increase in residents age 65 or older, 2006–16 |
|
Alabama |
15,390 |
14,200 (0.29%) |
16.13% |
2.89% |
|
Florida |
245,540 |
327,810 (1.59%) |
19.87% |
3.34% |
|
Georgia |
69,360 |
115,760 (1.12%) |
13.14% |
3.23% |
|
Louisiana |
-27,520 |
-1,820 (-0.04%) |
14.41% |
2.43% |
|
Mississippi |
-12,650 |
-1,320 (-0.04%) |
15.09% |
2.77% |
|
Tennessee |
49,210 |
66,580 (1.0%) |
15.74% |
3.03% |
Source: U.S. Census Bureau
As the nation's population continues to age, the number of people retiring and moving to warmer climates is bringing steady housing demand into the region. The southern states will likely see this trend persist while baby boomers continue to retire. However, when the high-demand trend begins to reverse, pockets of oversupply could pop up.
Fundamentals and trends
In some areas of the country, housing demand is outpacing available supply. Nationally, the year-over-year sale of existing homes (including single-family homes and condominiums) has dipped negative for the fourth month in a row. By February 2018, sales growth had fallen 11.1 percent compared to last year, according to CoreLogic's seasonally adjusted data. Since mid-2010, the number of home sales has trended upward, hitting 5.6 million in March—still shy by about 1.6 million homes of the 7.2 million seen at the peak of the expansion. As the number of sales climbs higher, the amount of inventory declines, in part because of lagging new supply.
One method for measuring the level of supply is knowing the months' supply in a market, which measures the number of months for which there would be enough housing supply at the current inventory level, given the current rate of absorption in the market. (This calculation excludes new construction.) Many industry analysts consider a healthy number of months of supply to range from four to six months. In March, the national months' supply was two months. The Sixth District as a whole had 2.1 months' supply, according to data from Zillow and CoreLogic. (Note that this calculation includes only finished vacant properties. The amount currently under construction boosts the months' supply numbers to above seven months. Under-construction space, however, is not being assessed because of possible delays in property delivery time that could skew the potential impacts.)
Some of the major markets across the region are experiencing even deeper supply strains than the District (see the table). Areas of note include Miami, West Palm Beach, and Nashville. New Orleans falls within the “healthy” range.
|
Market |
Months’ supply |
12-month home price appreciation |
|
Atlanta |
2.2 |
6.9% |
|
Birmingham |
2.1 |
4.9% |
|
Orlando |
2.2 |
6.9% |
|
Jacksonville |
2.7 |
6.9% |
|
Miami |
1.6 |
3.7% |
|
Fort Lauderdale |
2.6 |
5.3% |
|
West Palm Beach |
1.8 |
5.2% |
|
Nashville |
1.8 |
8.1% |
|
Tampa |
2.2 |
7.7% |
|
New Orleans |
4.6 |
7.8% |
Note: Data are current as of February 2018.
Sources: Zillow, CoreLogic
Because of the constrained supply, home price appreciation in many markets remains above the national average. One major concern is the impact of this appreciation on affordability, discussed below.
These charts use four District cities—Atlanta, Miami, New Orleans, and Nashville—to show trends in home price appreciation (in this case, the year-over-year change in home prices). These charts also measure changes in housing market prices over time, indexed so that the year 2000 is 100 points.
Except for Miami, these markets have prices well above peak prerecession prices. Miami lags the group, with its current home price index at 85 percent of its peak values. In some U.S. markets, home prices have yet to surpass peak pricing levels. The time when people were forced to hold onto their houses to avoid going underwater on their investment has largely passed. The question now is, where do people find their next home?
Residential—new supply
By the end of the fourth quarter of 2017, the United States was at 48 percent of the number of new home starts seen at the peak of the last expansion. At just over 400,000 new home starts for the past year, the number of new home starts has gradually inched upward each quarter since mid-2011. By the end of 2017, the number of new U.S. home starts was the same as it was in March 2008. A similar trend in markets across the District is apparent.
The pace of new supply has slowed in part because of labor constraints and construction costs. The Associated General Contractors of America conducted a Construction Outlook Survey for 2018 at the beginning of the year. The southern regional results came mostly from general contractors, specialty contractors, and construction managers. A majority of firms that responded reported difficulty in finding sufficient labor, which was tied for the top area of concern with increased competition for projects. Anecdotal evidence supports the claims of this sample of firms, specifically in the Sixth District. In fact, the Atlanta Fed's monthly Construction and Real Estate Survey made particular note in March 2018 of upward pressure on labor and material costs from a year earlier. Additionally, some markets have natural boundaries (Miami's coastline, for example) that prevent a particular speed of growth and require a different type of approach to supply constraints.
At the metro level, Atlanta, Orlando, and Tampa are among the top metros in the country in terms of the number of annual new home starts (Atlanta, 22,415; Orlando, 13,980; and Tampa, 10,292). But using the ZIP code level for a more granular look, a less exciting picture emerges. For Atlanta, annual new home starts (as of the fourth quarter of 2017) were 36 percent of peak values. Of the 175 ZIP code areas that make up the Atlanta metro area, only seven (or 4 percent) had at least 500 new starts in the past year. In Orlando, eight out of 88 ZIP codes (11 percent) had a minimum of 500 new starts. And in Tampa, five out of 126 (4 percent) ZIP codes had 500 or more starts, according to Metrostudy.
Given that new home construction appears geared more toward the high end of the market, new construction isn't likely to be a factor in loosening tight inventories. Between a modest influx of rental properties on the market and heightened construction costs, new houses around the country are selling for much more than the median existing home price. As homeowners look to move into larger homes, they put their existing homes on the market, giving the next income level the opportunity to buy a larger or nicer or more expensive house. This effect eventually trickles down to new homebuyers, the most price-constrained cohort.
Consumer affordability and bank risk
Affordability continues to be a concern as prices go up and the supply of affordable space dwindles. Many local governments are developing new policies to persuade or even require builders to set aside a certain proportion of residences for the low- and median-income communities, which leads builders to struggle to earn a profit as they build for that income range. Community developers and local governments closely monitor these trends. They should also monitor interest rates—a key factor surrounding affordability—and mortgage delinquencies, even though they have so far not shown any cause for concern. Rising interest rates place greater pressure on mortgage borrowing, which could result in a sudden decline in home prices.
For community banks in the Sixth District, at the end of 2017, demand for new housing was driving the growth in banks' construction and development (C&D) lending portfolio, according to Bank call reports. C&D lending has grown just over 10 percent year over year, with roughly half of that growth coming from the residential portfolio. Overall loan concentrations, as a percent of total risk-based capital, has declined somewhat (23 percent) from peak levels in 1- to 4-family lending. These dynamics merit close monitoring to ensure the continued safety and soundness of the financial system.
Strong economic growth in the Southeast, in part fueled by new job creation, has been a driving force for residential real estate demand in the region. Further, positive net in-migration to the Sixth District generates strong demand for housing. However, headwinds such as labor, construction costs, competition, and geographic constraints are tightening available supply in markets across the District and the country. Robust home price appreciation continues to push home prices higher. We are continuing to track trends across the residential real estate sector to monitor potential risks and market health as interest rates and market dynamics continue adjusting in this prolonged expansionary phase.