

Asset Quality
On a broad basis, asset quality metrics at community banks remained healthy in the second quarter. Short-term delinquencies, 30–89 days, continued to trend downwards, while longer term delinquencies (90 days or more) held steady (see the chart).
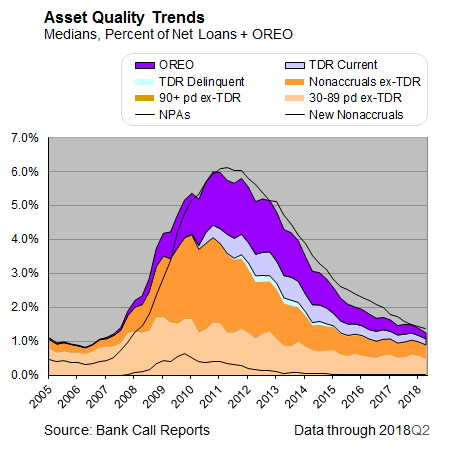
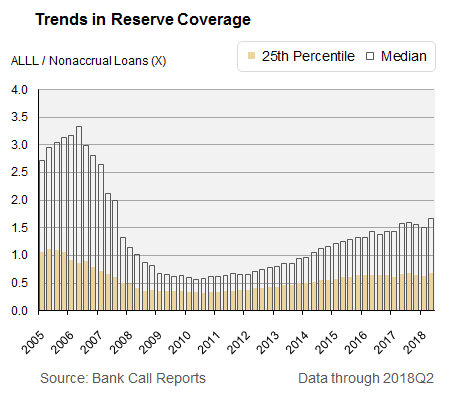
There have been no significant additions to nonaccrual loans over the last five years. The coverage ratio has returned to precrisis levels with the allowance for loan losses at 1.7 times nonaccrual loans (see the chart).
Nonperforming assets are below 2 percent as a percentage of total loans plus other real estate owned (OREO). Banks have disposed most of their OREO that was acquired during the crisis. Despite the strength of current metrics, concerns are developing about weakening loan underwriting. For example, the Federal Housing Administration has noted an increasing percentage of borrowers that have debt-to-equity ratios above of 50 percent as well an increase in cash-out refinancing and delinquencies. Credit reporting agencies also note increases in consumer delinquencies and charge-offs as balances on credit cards continue to grow, especially for riskier borrowers. The increases are coming off a low base, so although the level of increase appears large, overall delinquencies remain below historical norms. In addition, consumers are defaulting on subprime auto loans at a higher rate than during the 2008–09 financial crisis. Small business delinquencies are starting climb across multiple industries in the Southeast. The one exception is the transportation sector, where delinquencies are still trending down.
Balance Sheet Growth
Over the last three quarters, asset growth in Sixth District community banks has slowed, dropping from 4.5 percent on a median basis late in 2017 to just under 3 percent in the second quarter (see the chart).
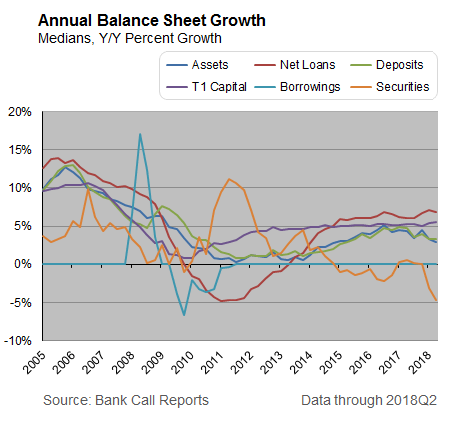
The prospect of rising rates has delayed new securities purchases, which has contributed to slower growth (see the chart).

Loans are the primary driver of the growth that is occurring. Balances grew at an annualized rate near 7 percent in the second quarter, slightly slower than the prior quarter. On a median basis, construction and development (C&D) lending grew the most during the quarter, topping 12 percent. In the aftermath of the financial crisis, banks in the Southeast had generally avoided C&D lending. In recent quarters, however, builders have ramped up construction to meet increased demand for housing, both single family and multifamily. Growth in commercial real estate (CRE) remained consistent with the prior quarter. However, more banks are indicating that they plan to tighten their underwriting standards for most CRE loans. Sixth District banks still remain heavily concentrated in CRE, at 174 percent of total risk-based capital (on a median basis), but the exposure remains well below peak levels from 2009.
Although home prices and rising interest rates are starting to put pressure on home buyers, residential mortgage lending continues to grow. Total residential lending increased 5 percent in the second quarter. Affordability, mortgage rates, and housing supply issues could lead to a slowdown in residential lending in the second half of the year. Affordability issues remain localized, however. For example, in the Miami market the median price of a home is set to surpass the level considered affordable by a median income buyer, which is a negative indicator for the housing market. Higher home prices have increased demand for home equity lines of credit (HELOCs), although banks remain cautious given the losses during the crisis. Commercial and industrial (C&I) loan growth held steady during the quarter, just above 6 percent.
Banks are trying to reignite the higher level of C&I growth they experienced earlier in the recovery by easing their lending standards, according to the Senior Loan Officer Opinion Survey. Banks have experienced significantly higher competition from nonbanks for small business loans in recent quarters as business owners say that nonbanks provide quicker decisions and an easier application process. In addition, China is one of the biggest trading partners for several states in the Sixth District, giving rise to concerns over the impact that trade uncertainty might have on C&I growth. Specifically, banks worry that the demand for businesses credit will fall as tariffs increase. Consumer lending remains a slow growth portfolio, just above 1 percent on a median basis in the second quarter. Lending practices tightened in the second quarter for credit cards but eased for autos. As with loans to small businesses, banks are also facing increased competition from nonbanks for consumer loans.
Capital
A stronger net interest margin and higher earnings helped maintain capital levels in the second quarter. On a median basis, the tier 1 capital ratio exceeded 15 percent, on par with the prior year and a slight improvement over the first quarter. Net income continues to be a key driver of improved capital levels. Dividend payouts have slowed in recent quarters, dropping to roughly 28 percent in the second quarter on an aggregate basis (see the chart).
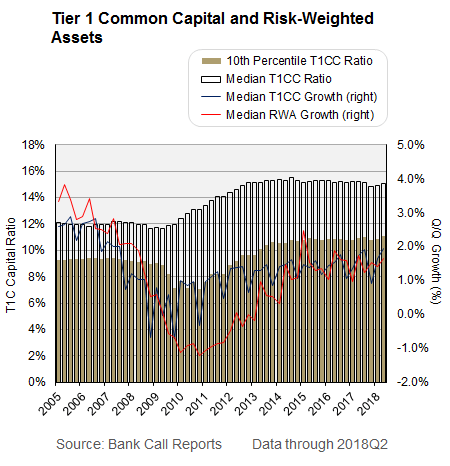
Risk-weighted assets continued to grow at a moderate pace—1.6 percent—with expectations for stronger growth as loan levels increase. Growth for risk-weighted assets remains much slower than prior to the financial crisis. During the second quarter, the president signed the Economic Growth, Regulatory Relief, and Consumer Protection Act of 2018. The legislation, which will be implemented over 18 months, revises certain aspects of capital and liquidity rules. A significant change to capital requirements is the adoption of a new statutory definition of high volatility commercial real estate acquisition, construction, and development loans, which will lower the number of credits that require higher risk weights. The change in risk weighting should help banks in the Sixth District that tend to be heavily involved in commercial real estate construction.
Earnings Performance
Earnings continue to improve for community banks in the Sixth District. The median return on average assets (ROAA) reached 1.20 percent, a postcrisis high for banks in the District (see the chart).
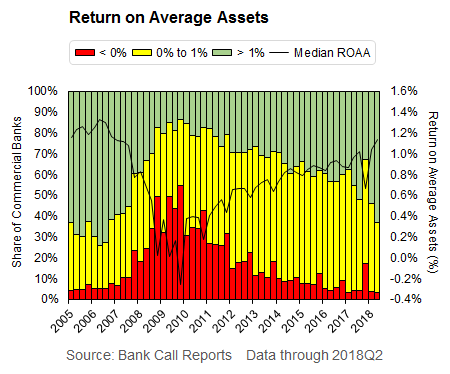
More than 60 percent of banks had a ROAA above 1 percent while only 3 percent of banks reported losing money. The share of banks with returns greater than 1 percent is on par with precrisis levels. The largest driver of earnings is the net interest margin (NIM). After years of compression, the NIM among Sixth District community banks exceeded 4 percent for the first time since the third quarter of 2007, when the financial crisis was just beginning (see the chart).
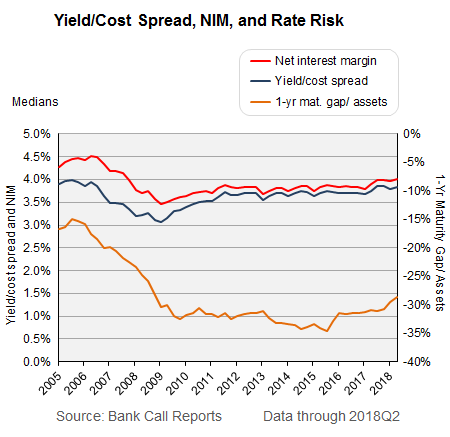
An increase in both loan growth and interest rates boosted interest income 34 percent year over year. Annualized loan growth jumped in the second quarter to 16 percent on an aggregate basis, the strongest growth rate in nearly two years. In addition, three fed funds rate increases since the beginning of the year have resulted in higher overall loan rates (see the chart).
As loan growth outpaces deposit growth, funding costs are also rising. In analyzing deposit betas, banks have yet to significantly increase the rates. Instead, banks are turning once again to other borrowed money to finance lending. Despite increases in funding costs, banks expect additional rate increases and continued economic growth will drive improved profitability through the second half of the year.
Banks have noted growing reluctance by businesses to borrow for expansion. However, the current projected path of rate increases is unlikely to significantly impede loan demand. Provisions for loan losses increased in the second quarter. Despite the slight increase, provisions still represent less than 1 percent of average loans. Asset quality remains healthy even as the current economic cycle reaches a near-historic length. Over the last four quarters, provisioning has been slightly higher than the level just prior to the financial crisis. Larger community banks are actively reviewing their current provisioning process as they develop data management systems to implement the Current Expected Credit Loss (CECL) as proscribed by the Financial Accounting Standards Board (FASB). Generating noninterest income has been a challenge for many community banks, especially after the passage of the Dodd-Frank Act. In the second quarter, noninterest income made a positive impact to ROAA, on a median basis, for the first time since the first quarter of 2017 (see the chart).
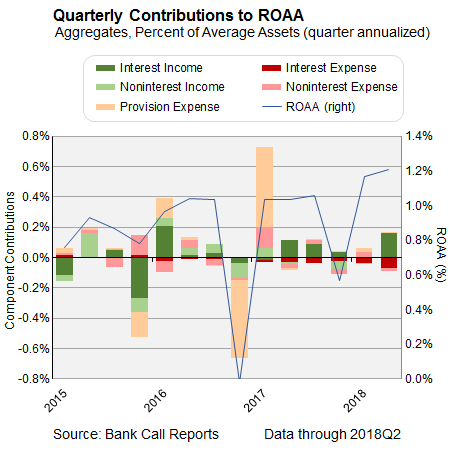
Growth in the stock market has led to increased wealth management fees and lowered realized losses on the sales of securities. Improvements in noninterest income were partially offset by declining loan fees, particularly on mortgage loans. In keeping with national performance, Sixth District banks' efficiency ratio has trended downward as banks have kept a tight rein on expenses.
Liquidity
Concern about the impact of increasing rates on deposits and liquidity is growing. Deposits fund a large portion of loans on the balance sheet. On a median basis, the loans to deposits ratio was 84 percent for community banks, a much more favorable ratio compared with prerecession levels. Over time, as customers sought safety, the deposit mix shifted toward low cost nonmaturity deposits. As rates increase, deposits may migrate within or leave the banking system. At the same time, loan growth has been outpacing deposit growth for many community banks (see the chart).
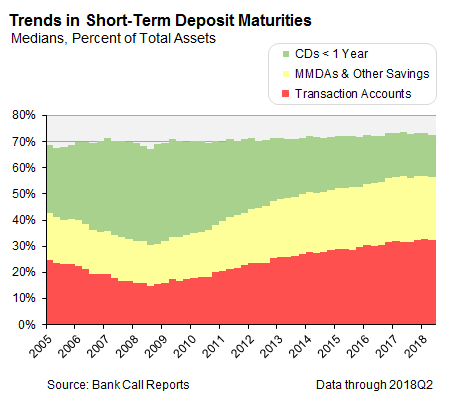
A concern is that banks, especially community banks, may start to rely too much on borrowing to fund additional loan growth if they can't retain or grow their deposit base (see the chart).
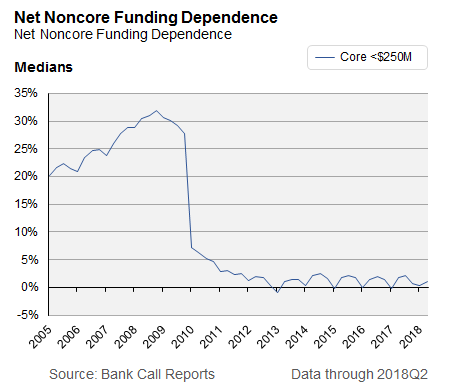
In the short term, overall repricing is expected to remain low through the second half of the year. So far, net noncore funding remains historically low, but the use of other borrowed money is starting to increase. Although there are cases of banks increasing deposit rates to remain competitive, that is the exception and not the norm as shown by the minimal one- and two-year basis point changes in median deposit costs across all commercial banks.
National Banking Trends
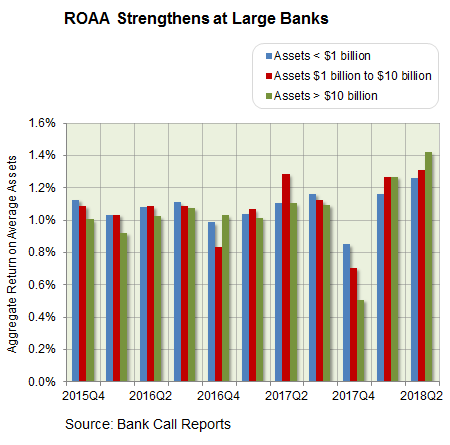
Low unemployment and higher business growth have driven improved earning for most banks. Along with economic growth, banks have benefited from higher interest rates, strong credit quality, and expense control. Higher interest rates drove earnings in the second quarter as net income rose almost 30 percent year over year, producing a return on average assets (ROAA) of 1.40 percent across banks of all sizes (see the chart).
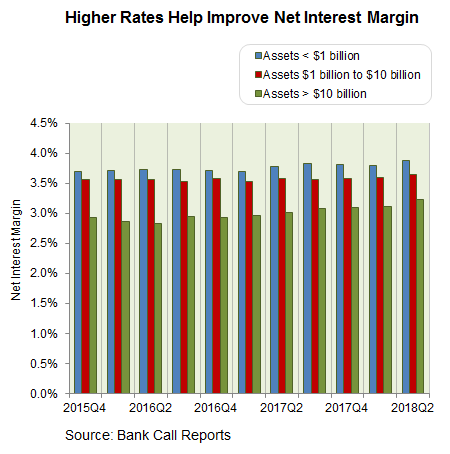
The net interest margin (NIM) expanded 20 basis points (bps) to 3.31 percent in the second quarter following another short-term rate increase. Compared with the prior year, noninterest income, as a percentage of total revenue, increased slightly, suggesting banks have been able to effectively charge more fees with the growth in business (see the chart).
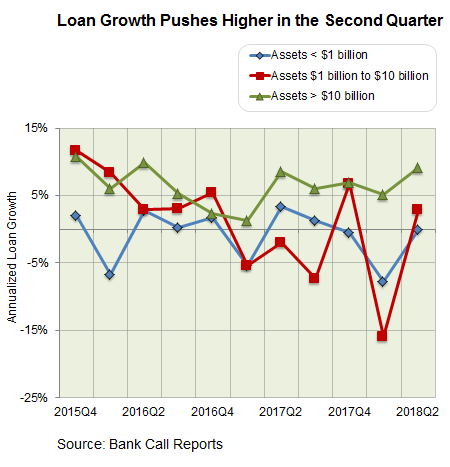
The efficiency ratio improved to 56.17 percent from 56.86 percent last year. The efficiency ratio is at its lowest level since the financial crisis as banks continue to emphasize cost savings. Asset growth in the second quarter improved at a relatively modest pace. Loans continue to drive total asset growth. Annualized loan growth increased to 5 percent in the second quarter. Despite the increase, loan growth in 2018 is falling short of industry projections. Loan growth was strongest at larger community banks. However, loan growth was barely positive for most smaller community banks (see the chart).
Banks point to a couple of reasons for the modest growth. One is increased competition from nonbanks. A second reason is that bankers have indicated that tax reform may be limiting demand for loans to expand businesses in the short term. During the second quarter, lenders have consistently commented that customers were using savings from the reform to pay down existing lines of credit. The industry continues to question when the credit cycle will turn. Currently, most banks are either stable or even showing continued improvement late in the credit cycle. Nonperforming loans, as a percentage of total loans, declined 20 bps year over year to 1 percent. Significant delinquencies, 90 days past due or greater, also declined slightly year over year. Even charge-offs have held steady year over year.
Although problem assets as a whole remain tame, there are signs that conditions are changing. Charge-offs for credit cards have started increasing, and banks appear to be pulling back on credit. Underwriting standards for commercial real estate loans loosened over the last two years as a result of increased competition, which may cause problems when the credit cycle starts to turn. Concern is also growing about the potential impact of rising rates on deposits and liquidity. As rates increase, there is a risk that deposits will migrate in search of higher returns. If this occurs, banks—especially community banks—may start to rely too much on borrowing to fund additional loan growth if they can't retain or grow their deposit base. Though there certainly are cases of some banks increasing deposit rates in order to remain competitive, this is not yet the norm as evidenced by the minimal one- and two-year basis point increase in median deposit costs across all commercial banks.