

Asset Quality
According to Call Report data, asset quality at banks in the Sixth District still appears healthy. On a median basis, nonperforming assets remain at a cyclical low of 1.32 percent. Data on new nonaccruals are now reported on a semiannual basis rather than quarterly, but new nonaccruals have remained very low during the past three years (see the chart).

The allowance for loan loss, as a percentage of nonaccrual loans on a median basis, has declined since the financial crisis due in part to the low levels of delinquent loans seen in the last four years. Despite positive asset quality metrics, examiners have noted that banks appear to be increasing their risk limits and risk appetites in certain portfolios such as residential mortgages and commercial and industrial (C&I) loans. Across several markets in the Sixth District, median FICO scores for mortgage originations have declined. Although the decline is not a large shift, it does reflect a greater willingness to take on risk, especially as home prices continue to climb. Outside of residential mortgages and C&I lending, banks are maintaining credit standards. Banks remain cautious about land acquisition, development, and single-family construction loans as credit conditions for those loans remain stable despite increased competition from nonbanks. One segment where banks appear to be reducing risk exposure is in other consumer lending, such as bank cards, where delinquencies are rising.
Balance Sheet Growth
Annualized balance sheet growth continued to slow for community banks in the Sixth District during the third quarter. Since peaking above 5 percent in the third quarter of 2016, growth dropped below 3 percent in the third quarter of 2018. Securities growth, on a median basis, turned negative in early 2018 as increasing interest rates put pressure on prices for debt securities (see the chart).
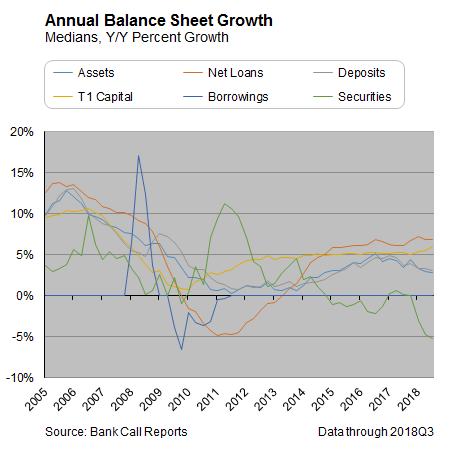
Loan growth remains positive, increasing at just under 7 percent on an annualized median basis. Although loan growth has slowed on a national basis, growth in the Sixth District has remained relatively flat during the last four quarters. Community banks are increasingly becoming more concentrated in a few loan portfolios. Since 2005, loan concentration in other consumer loans (excluding residential mortgage products) has been cut in half while the multifamily concentration has increased (see the chart).

The rise in interest rates has decreased demand for consumer loan products, including vehicle loans. Consumers are also looking to obtain financing from online lenders that provide an easier application process and a quicker credit decision. Community banks' exposure to Commercial and Industrial (C&I) loans is lower than before the crisis. Many banks used C&I loans to drive growth following the crisis, but the recent Senior Loan Officer Opinion Survey (SLOOS) have noted a slight tightening of underwriting standards. In addition, banks in the District have noted a shift in demand following tax reform and changes in trade policy. Several of the commercial firms in the Sixth District have begun to think about "near-sourcing" some of their production, which may weaken demand for C&I loans in more local markets. Near-sourcing is defined as strategically placing some or all of a business's operations close to where its products are sold.
For the remaining portfolios, banks noted that the market was extremely competitive for a variety of reasons. Bank exposures continue to be highest in the Commercial Real Estate (CRE) portfolio. Lenders report pressure to change underwriting standards to compete for CRE deals. The pressure to loosen standards is coming from nontraditional lenders, which are active in the secondary market. Commercial construction financing is also extremely competitive. Nontraditional lenders' activity increased sharply over the last year as CRE developers sought other sources of credit. Banks have maintained strong underwriting standards on construction lending after experiencing significant losses during the financial crisis. Institutions' abilities to compete with nonbanks for construction loans might have been hampered by the need to price in the higher capital requirements under the previous definition of high volatility commercial real estate (HVCRE). During the third quarter, a regulatory reform changed the definition of HVCRE, allowing appraised value to be counted as contributed capital. Banks expect that the new HVCRE definition will allow improved pricing and help drive growth.
Capital
Capital levels remain healthy. According to data from the Call Report, the aggregate total risk-based capital ratio is above 15 percent, and the total leverage ratio is above 10 percent (see the chart).

An increase in net income along with a decline in dividend payout helped boost capital levels during the quarter. Dividend payouts have declined year over year, dropping to roughly 22 percent in the third quarter on an aggregate basis. Even with stronger loan growth, median risk-weighted asset growth has remained flat for the last few quarters, growing around 2 percent. One reason for the slower growth might be the new statutory definition of high volatility commercial real estate-acquisition, construction, and development, which decreases the number of loans that require a higher risk weight. During the last few months, regulators have issued interim rules and proposals which would affect capital calculations for community banks. Among the proposals being discussed are the Community Bank Leverage Ratio, which would allow qualifying banking organizations with less than $10 billion in assets to meet capital requirements by maintaining a leverage ratio greater than 9 percent. These proposals result from requirements in the Economic Growth, Regulatory Relief, and Consumer Protection Act, which passed in May 2018.
Earnings Performance
The increasing interest rate environment has improved earnings for many community banks. In the third quarter, the median return on average assets (ROAA) for community banks in the Sixth District reached 1.17 percent. Over 60 percent of banks in the District had a ROAA above 1 percent, on par with the prior quarter, while only 3 percent of banks had negative earnings. The percentage of banks with ROAAs above 1 percent has returned to precrisis levels (see the chart).

The median net interest margin exceeded 4 percent for community banks in the District, 30 basis points higher than the same quarter in 2008. Given the upward shift in rates this year, a majority of banks experienced an increase in both net interest income and net interest margins in the third quarter (see the chart).

Although still below levels prior to the crisis, loan yields haves trended slowly upwards during the last eight quarters, reaching 5.80 percent in the third quarter. Increasing interest rates have also put pressure on funding costs, with a noticeable impact on earnings in the third quarter. Nearly 160 banks in the District experienced a decline in their net interest margin. Rising rates on interest bearing deposits resulted in the largest decline in the margin in more than three years (see the chart).

With increasing rates, banks are facing more competition for deposits and increasingly relying on noncore deposits or other borrowed money to fund loan growth. As yet, deposit rates for many community banks haven't significantly shifted, which appears to be affecting their ability to attract new deposits. However, consultants are counseling banks to look outside their traditional markets to gather deposits, by offering higher rates than are available in the banks' usual market.
Provisions for the allowance for loan losses as a percentage of total loans remained flat year over year. The lack of charge-offs and the slow growth of nonaccrual loans have decreased the amount that banks need to provide for potential losses. Noninterest income did not contribute significantly to earnings during the quarter. For banks with wealth management services, the volatile stock market affected income. Meanwhile, noninterest expenses increased slightly as banks invested in more technology to remain competitive and faced increased competition to attract and retain qualified employees. The median number of employees continues to decline at community banks in the District despite the improvement in the margin and overall earnings. Banks in the District have noted the difficulty retaining loan officers and other key staff members given current economic conditions.
Liquidity
Liquidity remains stable, year over year, at community banks in the Sixth District despite increased pressure on deposit gathering. The on-hand liquidity ratio has trended downward since 2013 but remains higher, on a median basis, for banks within the Sixth District than for banks outside the District (see the chart).

During the past year, asset growth continued to outpace deposit growth. Deposits fund a large portion of loans on the balance sheet. On a median basis, the loans to deposits ratio was 86 percent for community banks in the third quarter. The ratio remains more favorable than prior to the financial crisis but is trending upward again. On an aggregate basis, total deposits declined nearly 8 percent year over year. Deposits continue to shift toward transaction accounts and away from certificates of deposit (CDs). The percentage of CDs with maturities less than a year has dropped from 38 percent of deposits in 2009 to 16 percent in the current quarter. Rates on deposits are starting to increase, but pricing hasn't significantly shifted upward across most markets in the District. Sixth District banks are increasingly turning to brokers and deposit listing services to gather deposits rather than raising rates in their home market. In addition to more brokered deposits, banks are also using more Federal Home Loan Bank advances and other borrowed money.
National Banking Trends
Aggregate return on average assets (ROAA) for institutions of all sizes continued to climb in the third quarter 2018. The ROAA in aggregate was 1.41 percent, a 31 basis point improvement year over year. Banks with an asset size between $1 billion and $10 billion experienced the strongest ROAA growth over the prior quarter (see the chart).

Improved earnings are driven by higher interest rates that enhanced the net interest margin at most institutions. The net interest margin reached 3.3 percent in the third quarter on an aggregate basis, the largest margin enjoyed by banks in six years (see the chart).

Short-term interest rates have reached 2.25 percent for the first time in 10 years, the result of eight increases over the last 12 quarters. Margins, hovering just below 4 percent, are strongest at community banks with assets of $1 billion or less. Higher interest rates also affected funding costs as financial institutions relied more on borrowing and noncore deposits to fund asset growth.
Asset growth remains slower than the prior year (see the chart).

The biggest reason for the reduction is the decline in year-over-year loan growth. Loans represent 56 percent of total assets in aggregate, the highest level since the financial crisis. Despite current economic growth, banks are reporting lower demand across the majority of their portfolios, as a result of higher interest rates and tax reform. Demand has declined for consumer products, including vehicle loans. In addition, banks are facing increasing competition from fintech companies for a variety of loans, especially personal loans. Demand for home mortgages and home equity products has been affected by the increase in interest rates and home prices and tax reform. Home prices have reached an all-time high just as the new limits on the mortgage interest deduction are taking effect, which may be dampening interest in home buying. Commercial and industrial (C&I) loan demand has declined as businesses investment has been low and firms have higher cash flow as a result of tax reform, limiting the need to borrow. Banks have also noted that the recent changes in tariffs appear to be affecting C&I lending, and they have seen only incremental growth in lines of credit.
In general, asset quality continues to be a bright spot for banks in the current economic cycle. Call Report data doesn't show any significant deterioration in credit quality, perhaps signaling that banks have remained fairly conservative through this business cycle. Noncurrent loans, as a percentage of total loans, dropped below 1 percent on an aggregate basis (see the chart).

Allowance for loan losses represents more than 200 percent of nonaccrual loans. Charge-offs continue to decline as well, leading banks to reduce the level of the allowance over the last ten quarters. Although most asset quality metrics are positive, some institutions have experienced a sharp increase in bankcard delinquencies. At a national level, community bank card delinquencies are now on par with levels seen in 2008.
In addition, in the third quarter, banks continued to loosen underwriting standards because of slowing demand and increased competition, particularly in the residential mortgage and the commercial lending portfolios.