

Small businesses play a vital role in driving growth and providing employment in local economies across the nation. According to the U.S. Census Bureau and the Small Business Association (SBA), an estimated 30 million small businesses operate in the United States—about 99 percent of all U.S. businesses. Many of these small businesses (firms with fewer than 100 employees) rely on loans to pay start-up costs and support growth. Banks have traditionally been the largest provider of small business loans. In general, community banks have a smaller exposure (as a proportion of the overall portfolio) to small businesses through their commercial and industrial (C&I) portfolio than do large banks and alternative lenders. Although small business lending slowed dramatically during the financial crisis and in the early part of the recovery, it has largely recovered. Biz2Credit, a lender specializing in small businesses, estimates that community banks approve roughly 50 percent of C&I loan requests.
Given the current economy, with its tight labor markets and increased competition, community banks are exploring options to increase lending, diversify loan portfolios, and find new sources of noninterest income. At the same time, banks continue to try to minimize expenses. Since the crisis, given regulatory guidance and sector-specific risks associated with commercial real estate (CRE), community banks have taken a more conservative approach to CRE lending. Many community banks in the District have turned to C&I lending to drive growth. However, recent Senior Loan Officer Opinion Surveys noted a slight tightening of C&I underwriting standards across the nation.
Many community banks rely on SBA loan programs, backed by SBA loan guarantees, to provide loans to small businesses in their communities. The SBA offers several loan options designed to meet the financing needs of a range of business types. Providing low-risk alternative financing structures for borrowers can increase a bank’s profits. As the early days of the recovery demonstrated, banks’ portfolios can grow more rapidly through SBA lending and produce more fee income. In addition, it maximizes the legal lending limit, since only the unguaranteed portion of the loan is included in determining the limit.
The data tell the story
The SBA publishes data detailing loan activity for its loan programs. In this article, we focus on standard 7(a) small business loans, which have a maximum loan amount of $5 million. Such loans are 85 percent guaranteed up to $150,000, and 75 percent guaranteed for loans over $150,000. SBA data allow exploration of where small business lending is strongest and which industry is receiving the most financing in each market. Data from financial data firm PayNet provide additional insights on small business lending that is not necessarily covered by the SBA. PayNet’s data come from more than 25 million small and private business contracts, representing more than $1.7 trillion in obligations. Deeper analysis makes it possible to identify the potential impact of changes in small business lending, as well as potential risks to markets and individual banks.
Examining the nature of lending characteristics
Small business lending tends to be more concentrated in areas with larger populations since they provide more opportunities and diversity. States in the Atlanta Fed’s district have markets with both high and low population concentrations and growth, offering wide variation in job opportunities and desirability. Florida has attracted new residents from across the country, especially from the Northeast, for the last 30 years. Meanwhile, because of their educational and technological opportunities, Georgia, Tennessee, and Alabama have attracted people with advanced skills. For example, General Electric, Boeing, and IBM have offices in the Huntsville, Alabama, area, offering employment opportunities in STEM (science, technology, engineering, and mathematics) fields.
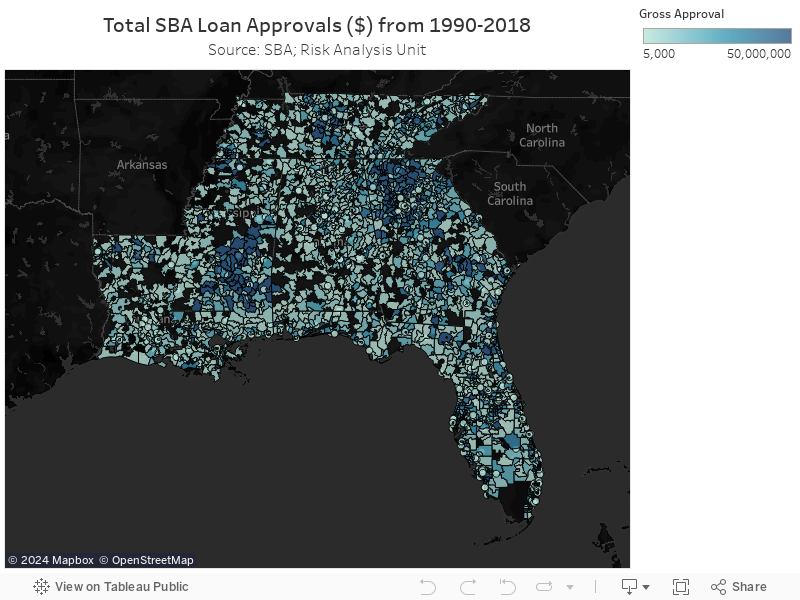
SBA data for the Atlanta Fed’s district show that small business loans tend to cluster in a few regions in each state. For example, in Alabama, SBA lending occurs more frequently in the Birmingham and Montgomery metro areas. More notably, during the past 28 years, Jefferson County—where Birmingham is located—had an aggregate total gross approval of SBA loans of $490 million, the most in the state. In 2018 alone, 75 SBA loans were originated in the Birmingham metro area (comprising seven counties), with a gross total of $61.7 million. Four core counties in metro Atlanta (Fulton, Gwinnett, Cobb, and DeKalb) accounted for 46 percent of total approved SBA lending in Georgia, with a combined total of $1.48 billion in 2018. In contrast, large sections of southwest Alabama, central Mississippi, and central Louisiana have had few or no SBA approvals over the last 28 years. Similar patches can be seen in south central Florida and eastern Georgia. In each of these areas, the population is much smaller and more rural. The data make it clear that these sparsely populated areas are not experiencing the same level of small business activity as the larger metropolitan areas (see the map).
Unlike the rest of the Sixth District, both Mississippi and Louisiana have lost population for several years now. More than 200,000 people fled Louisiana in the aftermath of Hurricane Katrina in August 2005. Though the population has recovered to pre-Katrina levels, growth has slowed, and some areas have even lost population (see chart 1). In Mississippi, the population decline may have resulted at least in part from a lack of opportunity in rural areas or from the state’s higher tax rates. According to census data, Mississippians have a state and local tax revenue rate of 10.57 percent, more than the national average (10.08 percent) and the Southeast average (8.57 percent).
Going back to 1990, SBA data show that Florida and Georgia have the highest small business financing by dollar volume. Both states have larger populations and higher population growth than other states in the region. Combined, Florida and Georgia had a total SBA gross approval amount of $6.4 billion in 2018. By comparison, the combined total gross approval amount for Alabama, Louisiana, Mississippi, and Tennessee was only $3.2 billion. In 2018, lending in Mississippi and Tennessee exceeded $1 billion each.
According to PayNet’s third quarter 2018 data set, the Sixth District ranked in the bottom quartile in terms of small business loan growth, at 5.85 percent. (However, Louisiana saw 140 percent and 264 percent spikes in year-over-year lending in 2014 and 2017, respectively.) Only two other Fed districts, those of the Philadelphia and St. Louis Feds, had lower origination growth. PayNet data have consistently shown slower origination growth in the Atlanta Fed’s district over time compared with the other Federal Reserve districts, which is unexpected given the population growth in the region.
Hospitality leads the industries
Exploring total loan dollars by industry can reveal lending concentrations. SBA data indicate that the hospitality industry (including hotels and restaurants) receives the most financing across the United States. Other top businesses include child care, dentists, and gas stations. A majority of these are service-providing industries. According to a January 2019 survey, the second-largest industry for small business ownership is food businesses and restaurants, which increased by 14 percent in 2018. Chart 2 below shows the top three industries and the corresponding loan amounts by state in the Atlanta Fed’s district.
Operating business environments vary across industries. The SBA establishes standards to determine size limits for lending to small businesses. The methodology behind the SBA’s size standards examines firm size distribution, competition, start-up costs, and entry barriers. Size standards are often a proxy for distinguishing among various industries to better understand financing nuances.
In the past five years in the Sixth District, chicken production has received $2.3 billion in financing (50 percent of it concentrated in Mississippi) despite having a size standard of $750,000 (see chart 3). By comparison, full-service restaurants, with a size standard of $7.5 million, received the same amount of financing within the same time period. The median loan interest rate for chicken producers in the region is 6 percent, which might indicate a high value-to-risk ratio for lenders. SBA lenders typically charge a variable interest rate from 2 to 2.75 percent above the prime rate, and this rate can vary based on numerous factors. Given similar credit quality, smaller loans typically carry a spread closer to 2.75 percent, and larger loan spreads are typically closer to 2 percent.
Examining the role of credit quality
Data from PayNet and the SBA also provide a perspective on how small business lending performs. According to the financial services company Moody’s Analytics, commercial banks in Sixth District states have relatively low delinquency rates: around 2.4 percent. However, certain industries, especially construction, show some weakness. PayNet reports loans to businesses in the construction industry have a higher delinquency rate (over 7 percent) than loans to businesses in other industries. This result makes sense, given the risks surrounding construction projects. For example, construction industry loans made in Alabama have had a higher delinquency rate than those made in other southeastern states during the economic recovery.
Alabama has also had a high level of delinquencies in the healthcare sector. Alabama has attracted a notable amount of medical research business. Nationally, delinquencies attributable to health care businesses are just over 2 percent nationally; health care delinquencies in Alabama are 24 basis points above the national average.
Moody’s and the credit reporting company Experian reported that delinquency rates for small businesses with fewer than 100 employees increased slightly in the fourth quarter of 2018. However, those delinquencies are not being charged off, elevating some elements of risk in the program. The 30–89 days-past-due rate was up 5 basis points, to 1.68 percent, on a quarter-over-quarter basis. According to SBA data, charge-offs in its lending program were at their lowest levels in five years at the end of the 2017 fiscal year, when the SBA charged off only 0.8 percent of $86.2 billion in unpaid principal balances from the program. The last time the charge-off rate was below 1 percent was 2013. The low rate might indicate that SBA lenders are effectively educating and preparing borrowers early in the process.
Assessing and understanding the risks
Banks that make SBA loans need to implement systems that ensure adequate compliance with SBA guidance. Some risks to consider are vendor-management issues surrounding third-party vendors that might not be complying with SBA guidance. In addition, poor documentation—and thus higher default rates—could result in a rejection or reduction in the payment of the SBA guarantee. To reduce the risk of not receiving the guaranteed amount on defaulted loans, a bank should ensure that employees receive adequate training to perform SBA-related duties, follow SBA-specific loan policies, and perform SBA lending audits.
The SBA guarantee offers some protection against default risk, guaranteeing up to 85 percent of losses on qualifying loans if lenders implement the appropriate controls. Knowing that loans are backed by the SBA makes banks more comfortable issuing the loans and providing access to capital that the entrepreneurs normally might not receive. Credit extended to borrowers beyond the guaranteed amount offers some insight into lender risk appetite and exposure. From 2014 to 2018, states with the highest proportion of nonguaranteed lending in the country loaned 40 to 50 percent nonguaranteed dollars of their total small business loans. Lenders should keep in mind the frequency of small business formations and dissolutions.
In the Sixth District, the amount of nonguaranteed lending remained at about 30 to 40 percent of total small business lending, with Georgia and Florida having the greatest exposure in terms of absolute dollar values, at $2 billion and $3 billion, respectively. For several years leading up to the financial crisis and during it, nonguaranteed small business lending in the Southeast increased and peaked in 2007 at 64 percent (in Alabama, the highest rate in the Sixth District) before contracting with the onset of the recession. Nonguaranteed lending in the region has still not returned to these levels.
Banks should also be mindful of “tall tree risk,” where large amounts of financing in an industry are distributed only among a small number of borrowers (see chart 4).
In the Sixth District, hotels had the largest amount of raw-dollar financing as well as the highest average loan amount per borrower. The region’s car wash industry also shows signs of this sort of risk.
By Lauren Terschan, Robert Canova, and Sasha Suarez from the Atlanta Fed's Supervision, Regulation, and Credit Division