

National affordability
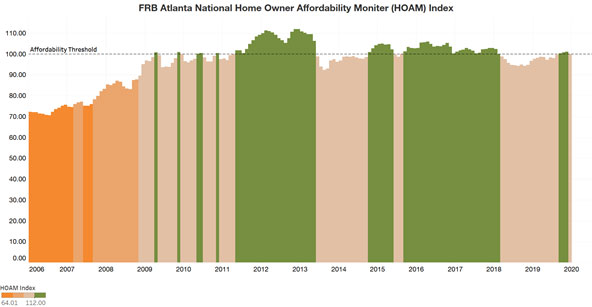
Declining interest rates and improving income growth had an overall positive impact on housing affordability over the past year. The 30-year fixed interest rate declined 77 basis points, ending the year at 3.74 percent. Additionally, the estimated median household income rose by 1.8 percent, ending the year at $62,215 nationally.
However, despite historically low mortgage interest rates and improved income growth, rising home prices kept total home ownership costs slightly above the 30-percent-affordability threshold,according to the Atlanta Fed's new Home Ownership Affordability Monitor (HOAM). On average, home ownership costs (that is, principal and interest, taxes, and insurance) represented a 30.01 percent share of the annual median income household in the United States. The national existing median home price rose by 7.7 percent from $250,667 in December 2018 to $270,000 in December 2019. As a result, the HOAM Index ended the year just below 100, with an index of 99.96 in December 2019, indicating that the U.S. housing market overall is slightly unaffordable.
Regional affordability
The story of home ownership affordability varies significantly by region. Most of the nation’s major metro areas would be considered affordable based on the HOAM Index. However, high-cost metro areas on the West Coast and in the Northeast and South Florida were the least affordable—in other words, total home ownership cost exceeded the 30 percent threshold. Meanwhile, metro areas in the middle of the country, particularly in the Midwest, tended to be the most affordable.
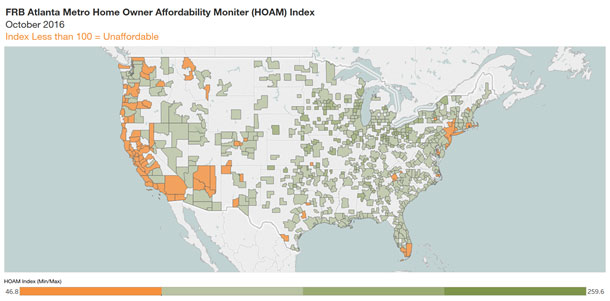
Among the nation’s largest metro areas—those areas with populations greater than 500,000—the least affordable was San Francisco, with an affordability index of 42.8. In 2019, the existing median home price in San Francisco, at $1.3 million, was the highest in the nation while the estimated median income in the area was $113,307. On the other hand, Detroit, Michigan, was the most affordable large metro area in the nation in 2019; it has a HOAM Index of 153.5. The existing median home price in Detroit was $151,150 and the median income was $61,465. Among smaller metro areas—those areas with populations lower then 500,000—Santa Cruz, California, was the least affordable, with an index of 52.9, and Carroll, Iowa, was the most affordable, with an index of 215.3.
Metro areas that experienced the greatest improvement in home ownership affordability over the past year tended to be those where home price growth was either flat or had declined and incomes had risen more sharply. For example, in Dutchess County–Putnam County, New York, the median existing home price declined by 1.1 over the past year while the estimated median household income rose by 9.3 percent. With declining mortgage interest rates, lower home prices, and rising incomes, the area saw a rise in the HOAM Index from 86.7 in December 2018 to 111.6 in December 2019. This amounted to a 28.8 percent increase in home ownership affordability.
At the same time, metro areas that experienced a sharper rise in home prices and more moderate growth in incomes showed the biggest declines in affordability. In Harrisonburg, Virginia, for example, the median existing home price rose by 16.6 percent over the past year (up from $207,967 in December 2018 to $242, 583 in December 2019) while the estimated household income in the area remained flat. As a result, the HOAM Index for the area declined from 103.3 to 98.9 as the share of income needed to afford the median-priced home rose above the 30-percent-affordability threshold.

Domonic Purviance
Senior Financial Specialist