Construction and Real Estate Survey Results
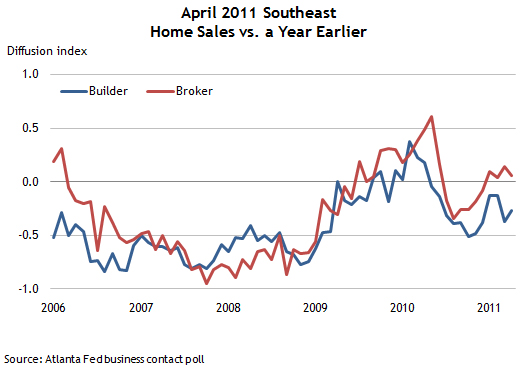
Reports from southeastern brokers indicated that sales in the region weakened slightly in April on a year-over-year basis; gains driven largely by Florida contacts. Builders reported new home sales remained below weak levels a year earlier.
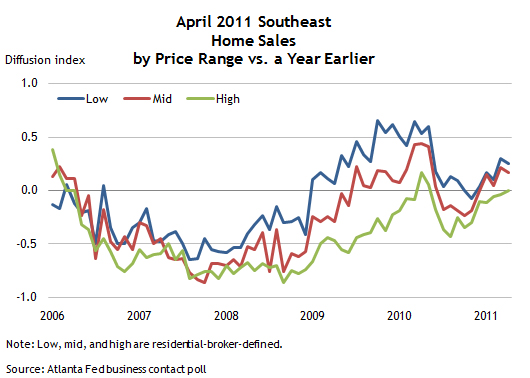
Brokers in the Southeast reported that low- to mid-priced home growth remained positive in April, while high-end-home sales were similar to the year-earlier level.
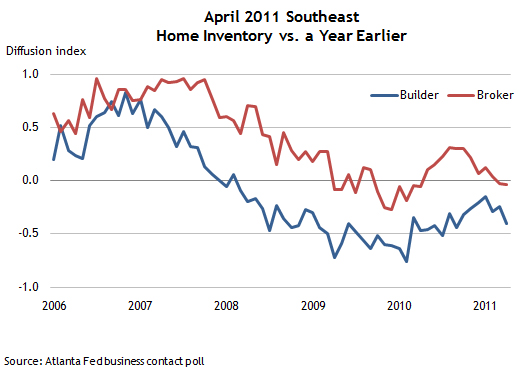
Reports from southeastern brokers and builders indicated that home inventories eased on a year-over-year basis.
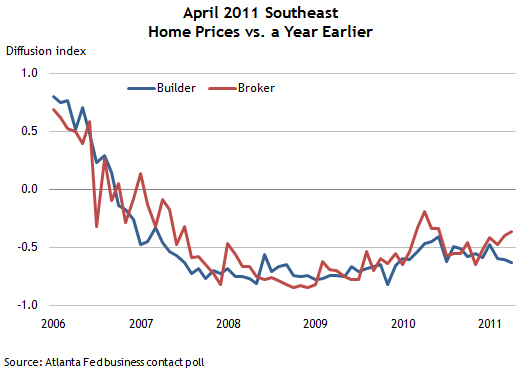
Southeastern brokers indicated that home price declines eased in April, while reports from builders indicated new-home prices were little changed. Most builders noted declines.
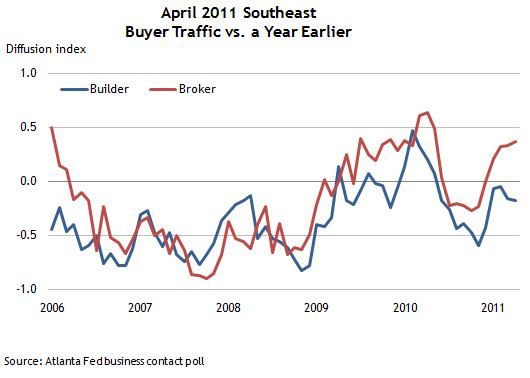
Southeast brokers reported stronger buyer traffic, while builders noted buyer interest continued to weaken.
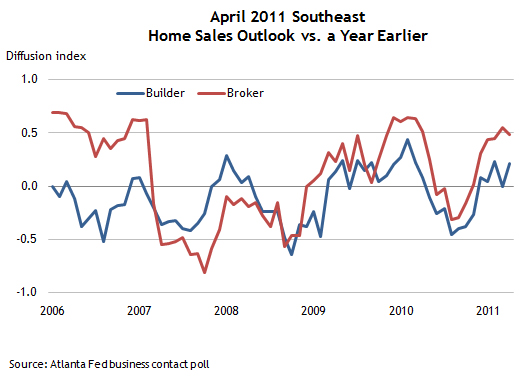
The outlook for sales growth among Southeastern residential brokers weakened slightly while that of builders improved.
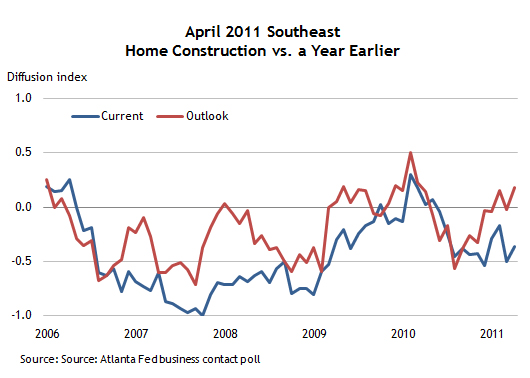
Southeastern builders reported that home construction activity remained weak in April while the outlook improved.
Note: April poll results are based on responses from 86 residential brokers and 35 builders. Responses were collected May 2–11.
The housing survey's diffusion indexes are calculated as the percentage of total respondents reporting increases minus the percentage reporting declines. Positive values in the index indicate increased activity; negative values indicate decreased activity.
The District Retail Survey showed disappointing activity in April amid adverse weather and high gas prices, but the outlook continued to be optimistic.
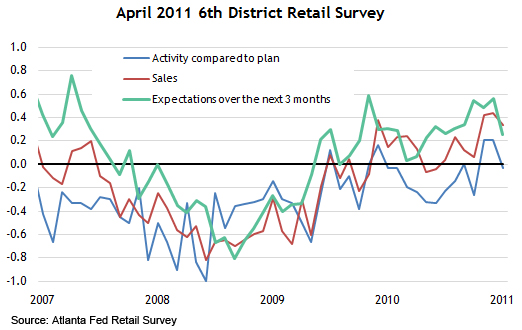
- The District Retail Survey showed decelerated retail activity in April following several months of moderate increases.
- District retailers noted that gas prices coupled with adverse weather, especially in Alabama, have dampened sales.
- Despite April's disappointing sales, most District retailers remain positive about the outlook. The percentage of retailers expecting an increase in sales was higher than in previous months.
Notes: Note: +1 = Increase 0 = No change –1 = Decrease
April survey results are based on responses from 36 retailers and were collected May 2–11.
The retail survey's diffusion index is calculated as the percentage of total respondents reporting increases minus the percentage reporting declines. Positive values in the index indicate increased activity while negative values indicate decreased activity.