As today's previous macroblog post highlighted, it seems that the United Kingdom's vote to leave the European Union—commonly known as the Brexit—got the attention of business decision makers and made their business outlook more uncertain.
How might this uncertainty be weighing on financial market assessments of the future path for Fed policy? Several recent articles have opined, often citing the CME Group's popular FedWatch tool, that the Brexit vote increased the probability that the Federal Open Market Committee (FOMC) might reverse course and lower its target for the fed funds rate. For instance, the Wall Street Journal reported on June 28 that fed funds futures contracts implied a 15 percent probability that rates would increase 25 basis points and an 8 percent probability of a 25 basis point decrease by December's meeting. Prior to the Brexit vote, the probabilities of a 25 basis point increase and decrease by December's meeting were roughly 50 percent and 0 percent, respectively.
One limitation of using fed funds futures to assess market participant views is that this method is restricted to calculating the probability of a rate change by a fixed number of basis points. But what if we want to consider a broader set of possibilities for FOMC rate decisions? We could look at options on fed funds futures contracts to infer these probabilities. However, since the financial crisis their availability has been quite limited. Instead, we use options on Eurodollar futures contracts.
Eurodollars are deposits denominated in U.S. dollars but held in foreign banks or in the foreign branches of U.S. banks. The rate on these deposits is the (U.S. dollar) London Interbank Offered Rate (LIBOR). Because Eurodollar deposits are regulated similarly to fed funds and can be used to meet reserve requirements, financial institutions often view Eurodollars as close substitutes for fed funds. Although a number of factors can drive a wedge between otherwise identical fed funds and Eurodollar transactions, arbitrage and competitive forces tend to keep these differences relatively small.
However, using options on Eurodollar futures is not without its own challenges. Three-month Eurodollar futures can be thought of as the sum of an average three-month expected overnight rate (the item of specific interest) plus a term premium. Each possible target range for fed funds is associated with its own average expected overnight rate, and there may be some slippage between these two. Additionally, although we can use swaps market data to estimate the expected term premium, uncertainty around this expectation can blur the picture somewhat and make it difficult to identify specific target ranges, especially as we look farther out into the future.
Despite these challenges, we feel that options on Eurodollar futures can provide a complementary and more detailed view on market expectations than is provided by fed funds futures data alone.
Our approach is to use the Eurodollar futures option data to construct an entire probability distribution of the market's assessment of future LIBOR rates. The details of our approach can be found here. Importantly, our approach does not assume that the distribution will have a typical bell shape. Using a flexible approach allows multiple peaks with different heights that can change dynamically in response to market news.
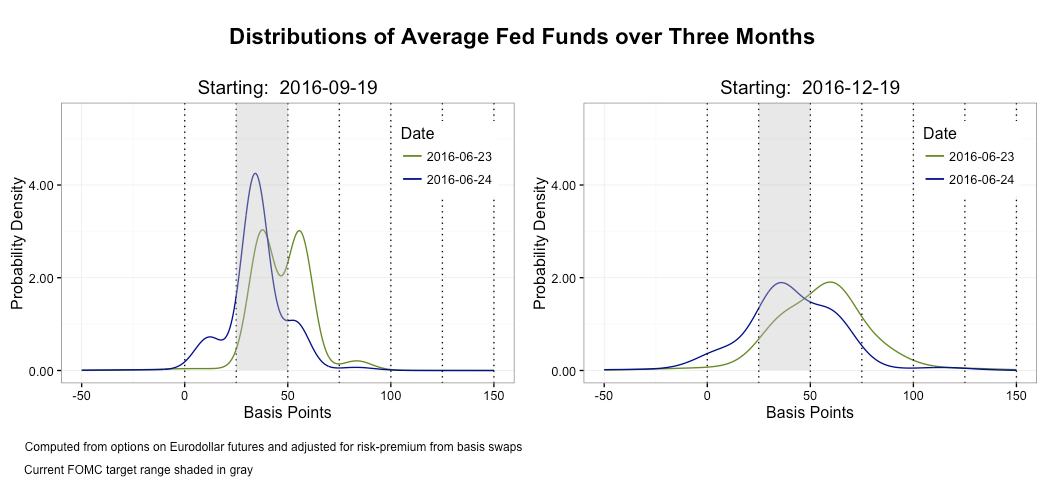
The results of this approach are illustrated in the following two charts for contracts expiring in September (left-hand chart) and December (right-hand chart) of this year for the day before and the day after Brexit. With these distributions in hand, we can calculate the implied probabilities of a rate change consistent with what you would get if you simply used fed funds futures. However, we think that specific features of the distributions help provide a richer story about how the market is processing incoming information.
Prior to the Brexit vote (depicted by the green curve), market participants were largely split in their assessment on a rate increase through September's FOMC meeting, as indicated by the two similarly sized modes, or peaks, of the distribution. Post-Brexit (depicted by the blue curve), most weight was given to no change, but with a non-negligible probability of a rate cut (the mode on the left between 0 and 25 basis points). For December's FOMC meeting, market participants shifted their views away from the likelihood of one additional increase in the fed funds target toward the possibility that the FOMC leaves rates where they are currently.
The market turmoil immediately following the vote subsided somewhat over the subsequent days. The next two charts indicate that by July 7, market participants seem to have backed away from the assessment that a rate cut may occur this year, evidenced by the disappearance of the mode between 0 and 25 basis points (show by the green curve). And following the release of the June jobs report from the U.S. Bureau of Labor Statistics on July 8, market participants increased their assessment of the likelihood of a rate hike by year end, though not by much (see the blue curve). However, the labor report was, by itself, not enough to shift the market view that the fed funds target is unlikely to change over the near future.
One other feature of our approach is that comparing the heights of the modes across contracts allows us to assess the market's relative certainty of particular outcomes. For instance, though the market continues to put the highest weight on "no move" for both September and December, we can see that the market is much less certain regarding what will happen by December relative to September.
The greater range of possible rates for December suggests that there is still considerable market uncertainty about the path of rates six months out and farther. And, as we saw with the labor report release, incoming data can move these distributions around as market participants assess the impact on future FOMC deliberations.


 By
By