Note: The author thanks Larry Wall for valuable comments and suggestions.
Since early 2021, global bond markets have undertaken a massive repricing of the monetary policy stance and economic/inflation outlook across the yield curve. One of the main drivers of this repricing was the aggressive tightening cycle by global central banks, triggered by highly elevated inflation. Figure 1 shows the extent of the cumulative tightening by major central banks (over time and across jurisdictions).
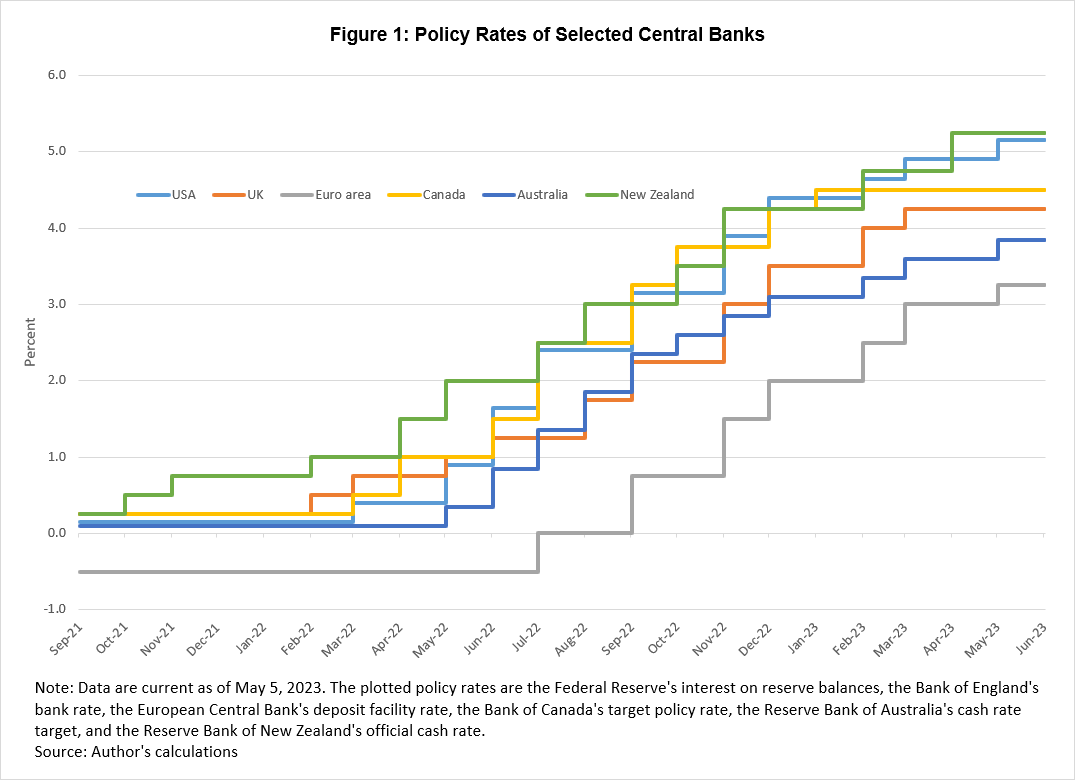
Despite some heterogeneity in the timing and pace of the policy tightening, the "synchronized" nature of the tightening cycle is evident from the chart. During the last year and a half, the cumulative rate hikes across these six major central banks were in excess of 25 percentage points, and these hikes have also been accompanied by a normalization of their balance sheet size.
How does the shape of the US yield curve reflect this cumulative tightening, including the uncertainty around its lagged effects? A conventional reading of the yield curve uses a term spread as a summary measure of economic and financial conditions. An important determinant of the shape of the yield curve is market participants' predictions of future policy rates and, given the global nature of bond markets, the future global monetary policy stance. An inverted curve may suggest expectations of lower policy rates in the future, a prediction most likely realized if the economy or the financial sector—or both—experience a significant downturn. Figure 2 plots the average "bond carry" (averaged over maturities) that represents the adjusted slope of the forward curve (for further reading, see here![]() and here).
and here).

For this relatively short historic period, the average bond carry tends to lead to tightening lending standards by commercial banks (see here![]() ), which in turn precedes, by several quarters, a reduction in loan growth by banks. Importantly, the recent sharp inversion of the forward curve suggests potential weakness in the economic and financial outlook of the economy.
), which in turn precedes, by several quarters, a reduction in loan growth by banks. Importantly, the recent sharp inversion of the forward curve suggests potential weakness in the economic and financial outlook of the economy.
As changes in risk appetite and other technical factors can affect the shape of the yield curve, extracting the monetary authority's risk-adjusted (net of risk/term premia) policy rate path can elicit more relevant information. But given the global cumulative tightening presented in figure 1, this decomposition should incorporate potential spillover effects from international bond markets (see, for example, here![]() ). For this reason, to better understand the future evolution of the policy rate, I resort to a stylized term structure model that is augmented with a "global" factor (for more details, see here) to extract a cleaner signal from the US yield curve on the expected effect of this global cumulative tightening (see here
). For this reason, to better understand the future evolution of the policy rate, I resort to a stylized term structure model that is augmented with a "global" factor (for more details, see here) to extract a cleaner signal from the US yield curve on the expected effect of this global cumulative tightening (see here![]() and here
and here![]() ). I should note that the future evolution of this global tightening cycle will likely depend on the structure of individual economies (for example, dominance of interest rate–sensitive sectors such as housing and the prevalence of floating and variable-rate debt), a country's underlying inflation pressures and their drivers, exposures of banks and shadow banks to duration risk, etc. All these factors require a more rigorous, data-informed analysis, which, unfortunately, is heavily distorted by pandemic, commodity, and supply chain shocks, as well as seasonal adjustment complications (see here
). I should note that the future evolution of this global tightening cycle will likely depend on the structure of individual economies (for example, dominance of interest rate–sensitive sectors such as housing and the prevalence of floating and variable-rate debt), a country's underlying inflation pressures and their drivers, exposures of banks and shadow banks to duration risk, etc. All these factors require a more rigorous, data-informed analysis, which, unfortunately, is heavily distorted by pandemic, commodity, and supply chain shocks, as well as seasonal adjustment complications (see here![]() ).
).
Figure 3 plots the model-implied, expectational ("risk-neutral" or risk-adjusted) component that is embedded in the forward curve. The chart traces out the expected path for the current quarter (the second quarter of 2023, the solid blue line) as well as the corresponding path for the third quarter of 2022 (the dotted red line) and the first quarter of 2022 (the dashed yellow line).
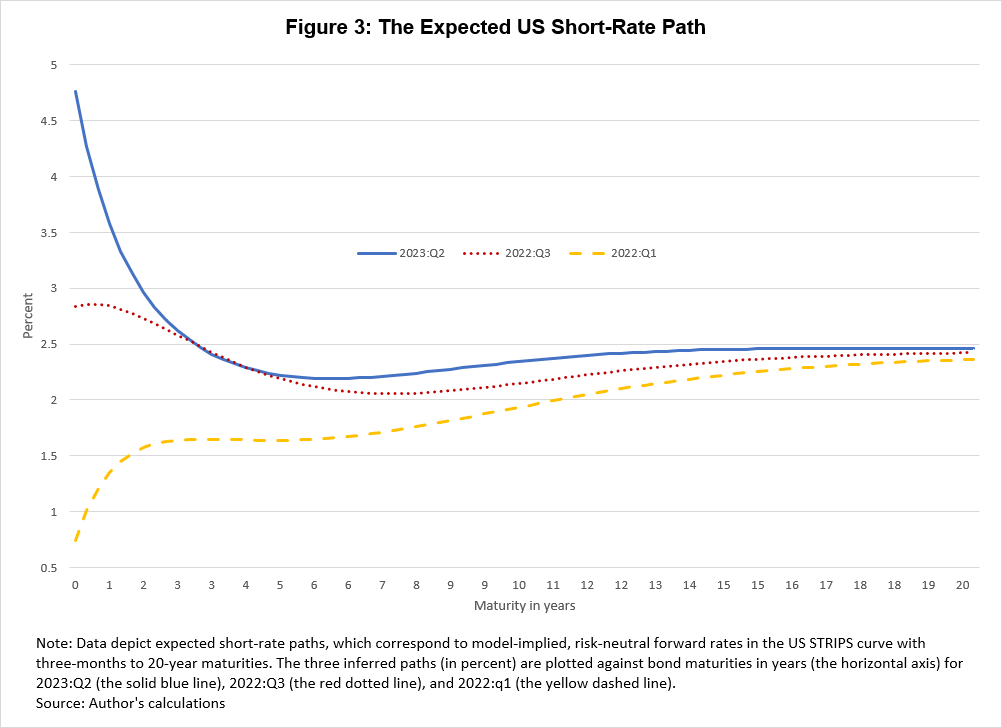
Figure 3 clearly illustrates the aggressive repricing by the bond market in the last year. It depicts a material shift upward of the short end of the curve and the associated changes in the shape of the curve, going from gently upward sloping between two-year and 10-year tenors in the first quarter of 2022 to a mild inversion in the third quarter of 2022 and subsequently a deep inversion in the current quarter. The repricing in the last few quarters seems to have occurred at the front end of the curve, with the three-year to 20-year segment largely unchanged. Interestingly, despite these substantial moves over time and across maturities, the long end of the curve remained fairly anchored around the Federal Open Market Committee's estimate of the long-run fed funds rate of about 2.5 percent. It should be noted that apart from the front end of the curve (which is better characterized by the SOFR![]() and OIS
and OIS![]() curves), the path over the medium to long run is broadly in line with the Fed's projections (here
curves), the path over the medium to long run is broadly in line with the Fed's projections (here![]() ) and those of market participants (here
) and those of market participants (here![]() ). The inversion of the projected short-rate path can be attributed to the market's future outlook for growth and inflation as well as heightened levels of economic and geopolitical uncertainty. But the largest contributor to the sharp inversion in the belly of the curve appears to be the global factor dimension of the model, suggesting that the global tightening (proxied, for example, by inversions also in the Canadian and German bond curves) seems to be reflected in the US yield curve. Importantly, incorporating this international perspective into the yield curve modeling results in a much more pronounced inversion of the model-implied forward path.
). The inversion of the projected short-rate path can be attributed to the market's future outlook for growth and inflation as well as heightened levels of economic and geopolitical uncertainty. But the largest contributor to the sharp inversion in the belly of the curve appears to be the global factor dimension of the model, suggesting that the global tightening (proxied, for example, by inversions also in the Canadian and German bond curves) seems to be reflected in the US yield curve. Importantly, incorporating this international perspective into the yield curve modeling results in a much more pronounced inversion of the model-implied forward path.
The other component—one that is a bit more obscure—is the term premia, which is defined as the extra return that investors demand to hold long-term bonds (for details, see here![]() ). This component of bond yields is of interest to monetary policy makers as they attempt, for example, to lower the term premium via large-scale asset purchases at times of monetary policy accommodation (see here
). This component of bond yields is of interest to monetary policy makers as they attempt, for example, to lower the term premium via large-scale asset purchases at times of monetary policy accommodation (see here![]() and here
and here![]() ). Figure 4 presents the model-implied term premium estimates for bonds with two-year to 20-year maturities. In the prepandemic period, the term premia at longer maturities exhibit a downward trend that largely reflects declining inflation uncertainty, elevated demand for safe assets and collateral, and constrained balance sheet capacity by intermediaries, among other factors. Since 2021, however, this trend appears to have reversed.
). Figure 4 presents the model-implied term premium estimates for bonds with two-year to 20-year maturities. In the prepandemic period, the term premia at longer maturities exhibit a downward trend that largely reflects declining inflation uncertainty, elevated demand for safe assets and collateral, and constrained balance sheet capacity by intermediaries, among other factors. Since 2021, however, this trend appears to have reversed.
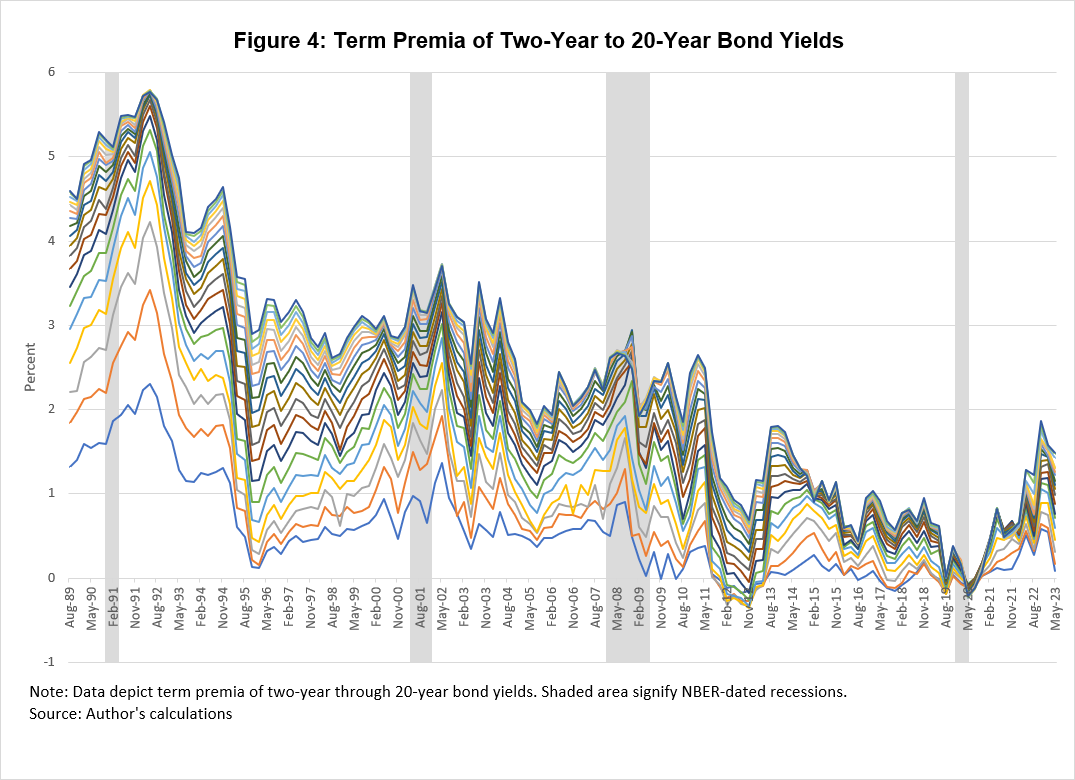
Two additional interesting observations emerge from figure 4. First, the inclusion of a global factor tends to produce term premium estimates that are mostly positive, which stands in contrast with the conventional estimates (differences may also arise from the nonsmoothed nature of the STRIPS curve![]() as well as the quarterly frequency of the analysis). Second, figure 4 suggests a compression of term premia across maturities after 2015 that bears similarities to the persistent compression in inflation breakeven rates and inflation risk premia, documented here
as well as the quarterly frequency of the analysis). Second, figure 4 suggests a compression of term premia across maturities after 2015 that bears similarities to the persistent compression in inflation breakeven rates and inflation risk premia, documented here![]() . Only recently, we are observing a widening of the term premia, which likely reflects an increasing inflation risk premium, elevated rate volatility, and larger net Treasury supply that the private sector needs to absorb during the Fed's balance sheet normalization.
. Only recently, we are observing a widening of the term premia, which likely reflects an increasing inflation risk premium, elevated rate volatility, and larger net Treasury supply that the private sector needs to absorb during the Fed's balance sheet normalization.
To conclude, global central banks have responded to the large and persistent inflation surge over the last two years by engaging in a rapid tightening cycle. This "coordinated" global monetary policy reaction is potentially magnifying financial tightness whose time-series and cross-country cumulative effects are difficult to assess in real time because of potential nonlinearities in the transmission mechanism, highly financialized and indebted economies, levered financial systems with pervasive frictions, etc. Synthesizing information from bond prices and term structure models provides valuable real-time guidance for policy makers and market participants.

By Nikolay Gospodinov, financial economist and senior adviser in the Atlanta Fed's Research Department