Dennis Lockhart
President and Chief Executive Officer
Federal Reserve Bank of Atlanta
The University of Tennessee
Knoxville, Tennessee
February 25, 2013
Key points
- Atlanta Fed President and CEO Dennis Lockhart talks to students at the University of Tennessee in Knoxville about monetary policy and the employment markets.
- Lockhart expects the U.S. economy in 2013 to continue to expand slowly but steadily, with GDP growth between 2 and 2 1/2 percent. The data show some encouraging signs that growth could be even better.
- Lockhart: The FOMC has improved communications about the future path of policy. The committee has stated that the target federal funds rate would likely stay fixed until the official unemployment rate reaches a threshold of 6 1/2 percent.
- Lockhart discusses the complexities and challenges associated with assessing overall labor market health and outlines how monitoring a set of indicators can help track uneven progress in employment conditions.
- Lockhart states that the extent of structural labor market impediments must be considered in estimating the efficacy and cost of policy actions. Longer-term potential costs should be balanced against policy actions designed to achieve "substantial improvement" in the outlook for labor markets.

It's a pleasure to be back in Knoxville and at the University of Tennessee.
As you may know, the Federal Open Market Committee (FOMC), the monetary policy-setting body of the Federal Reserve, has two overriding objectives. They are promoting stable prices and fostering maximum employment. The achievement and the balancing of these two objectives are always front-and-center concerns of the FOMC.
The focus of my remarks today will be on how I view the status of this balancing act in the context of the FOMC's current program of open-ended asset purchases. I will give particular attention to the state of the employment markets, the improvement of which is a central purpose of the asset purchase program.
My remarks this evening reflect my own thinking on these subjects and do not necessarily reflect the views of my colleagues on the FOMC or in the Federal Reserve System.
Current economic situation and outlook
I'll start with a summary of current economic conditions and my outlook for 2013.
The overall economy ended last year with a weak quarter as measured by gross domestic product (GDP). However, I don't take much signal from this number because the reasons for it were largely technical and transitory. Most significant among these was a large decline in government spending after an unusual increase in the third quarter of last year. Outside this decline in government spending, GDP rose at close to a 2 percent pace in the fourth quarter.
Our readings of the incoming data, complemented by anecdotal characterizations of the economy provided by our contacts across the Southeast, suggest a continuation of a 2 percent GDP trend in the first quarter. For 2013 overall, I expect GDP growth to come in between 2 and 2 1/2 percent. This pace of growth implies steady, but not accelerating, net job creation. At this pace of expansion, unemployment will likely continue to decline gradually.
I think the risks around this outlook are currently pretty much in balance. Congress and the administration still have some very controversial fiscal issues to negotiate. My outlook assumes some amount of fiscal drag from spending cuts, but does not assume a political shock resulting from a self-inflicted crisis of some kind.
It also appears that the biggest downside risks associated with the European sovereign debt problems have been contained. These risks have receded, in part, through monetary policy actions by the European Central Bank and through progress on a common supervisory framework for the euro zone's financial system.
I see some potential that the U.S. economy could do better than growth between 2 and 2 1/2 percent. The economy has been growing at a sluggish rate of around 2 percent since the recovery began in the summer of 2009. Although still rather mixed, the data show some encouraging signs. For instance, the housing market appears to have stabilized and begun a recovery as measured by home sales, house prices, and, to some extent, construction activity. Despite some recent movement in gasoline prices associated with seasonal influences and refining capacity, the domestic energy industry is vibrant in both exploration and production. And the auto industry, important in the Southeast, continues to record strong sales. Of these three examples of relative strength, both housing and autos are interest-rate-sensitive sectors.
If momentum continues and some of the potholes out there are avoided (particularly a political crisis around fiscal decisions), growth could accelerate. I admit it's a qualitative assessment, but I sense rising optimism among much of the public in terms of economic prospects. Although it's not reflected in our baseline forecast, I detect a growing conviction that the economy is beginning to emerge from a long spell of anemic performance.
Inflation
The inflation rate fluctuated fairly widely last year, mostly pushed about by volatile gasoline and food prices. But if you step back and look at the trend of prices with a broader perspective, inflation has been measured at a level persistently under the FOMC's longer-term objective of 2 percent. At times, the rate has been closer to 1 percent. To significantly and persistently undershoot the central bank's inflation target could be worrisome in some circumstances, but, at this point, I think the inflation outlook is benign.
Stance of monetary policy
Against the backdrop of the picture I just painted, monetary policy remains very accommodative. I know that sounds like central banker speak. To translate, very accommodative means low interest rates that are intended to stimulate borrowing by businesses and consumers that will in turn have the effect of expanding economic activity. The FOMC's policy rate—the overnight federal funds rate—remains effectively as low as it can go. In addition, the Fed is purchasing longer-maturity Treasury and agency mortgage-backed securities. This purchasing program is a tool of monetary policy popularly referred to as quantitative easing. These purchases are intended to keep downward pressure on long-term interest rates and support financial asset prices.
It's difficult in any precise way to isolate the effectiveness of this policy. But I believe the FOMC's monetary policy actions overall have without question helped achieve the economic progress we've made since the end of the recession. These policies have also helped to bring us to the current environment in which the presumption of continuing and potentially quickening progress is a reasonable one.
FOMC's guidance regarding interest rates
To support the effectiveness of policy, the FOMC has undertaken a number of measures to improve communications with the public about the future path of policy. Most recently, the FOMC stated that its short-term policy interest rate —that is, the target federal funds rate—would in all likelihood remained fixed where it is today at least until the official unemployment rate reaches a threshold of 6 1/2 percent. In my view, full employment in the longer term—the ultimate objective—corresponds to a rate of unemployment somewhat below 6 1/2 percent, so this threshold is an interim goal on the way to full employment. We made this threshold explicit in part to allow members of the public to gauge progress in the labor markets and draw their own conclusions about how long financing rates are going to remain at bargain levels.
FOMC's communication regarding large-scale asset purchases
Communication around quantitative easing—also referred to as large-scale asset purchases—has also evolved. We are now in the third round of quantitative easing since it was first introduced in November 2008. In the previous two rounds, the FOMC gave explicit quantitative targets for total purchases and the expected time frame of the programs. In the most recent round, the Committee did not state an explicit amount or duration of purchases. Instead, the Committee has conditioned continuing the purchases on achieving a qualitative criterion, which is "substantial improvement in the outlook for labor markets."
It's important to note that the statement that laid out this criterion also mentioned consideration of the efficacy and costs of the program. In other words, pursuit of "substantial improvement" would be tempered by assessment of whether the policy is in fact working and whether the degree to which it is working justifies what might be the longer-term unintended negative consequences of such extraordinary monetary expansion.
Interpreting "substantial improvement..."
Unlike the 6 1/2 percent unemployment rate threshold of the Fed's policy for the federal funds rate, the threshold for quantitative easing is not straightforward. "Substantial improvement" may be in the eye of the beholder.
Last November, I spoke in Chattanooga about the complexities of assessing the health of the nation's employment situation. I argued in that speech that relying on a single metric like the unemployment rate is simplistic and potentially problematic. When the Committee took the step of conditioning the size and duration of the latest asset-purchase program on "substantial improvement," we widened, in my opinion, the number of considerations.
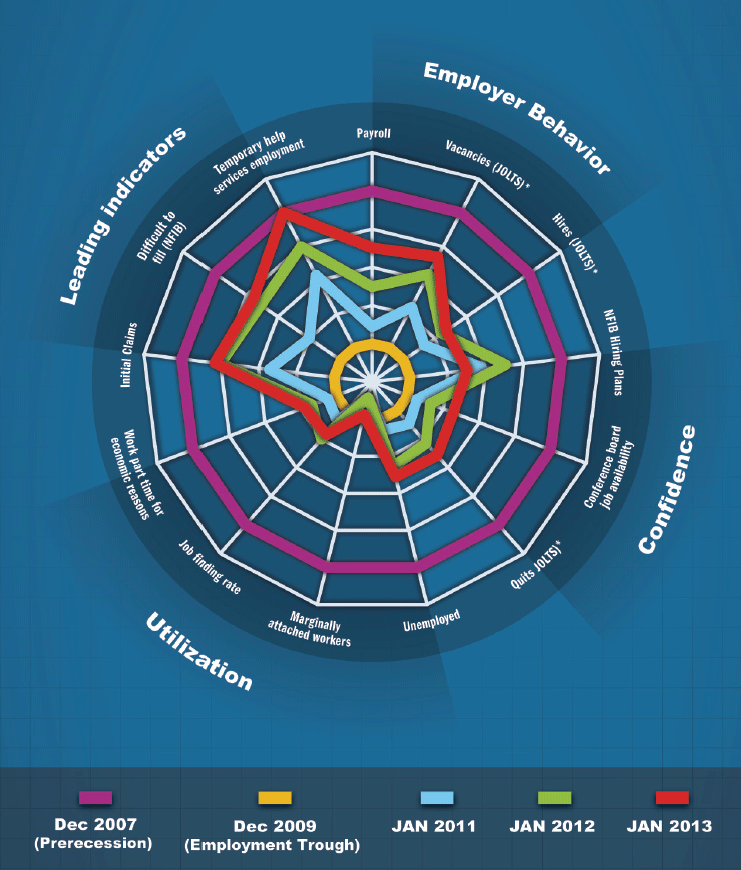
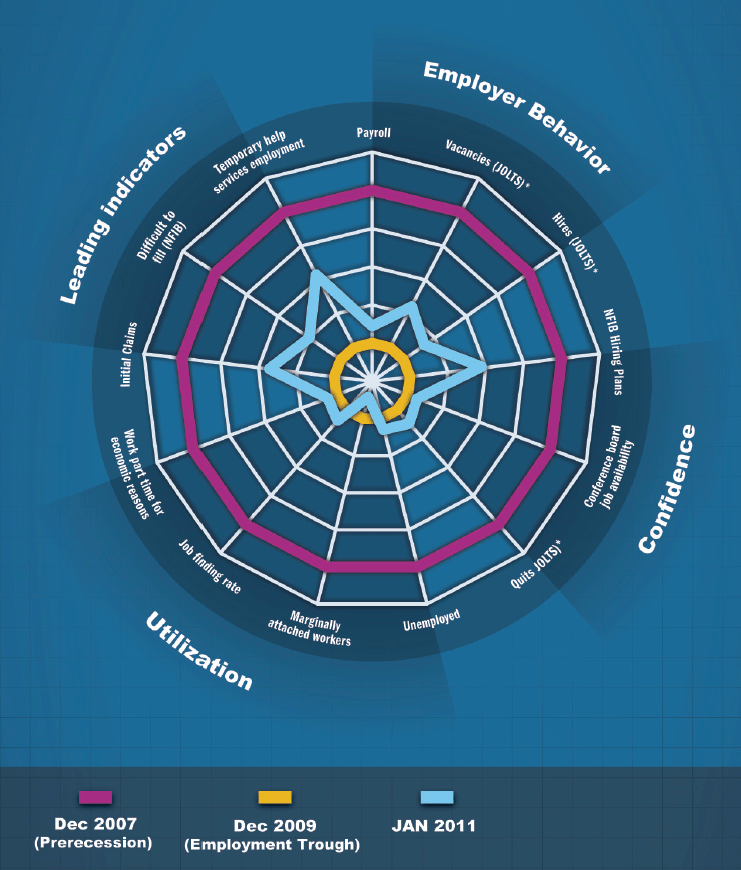
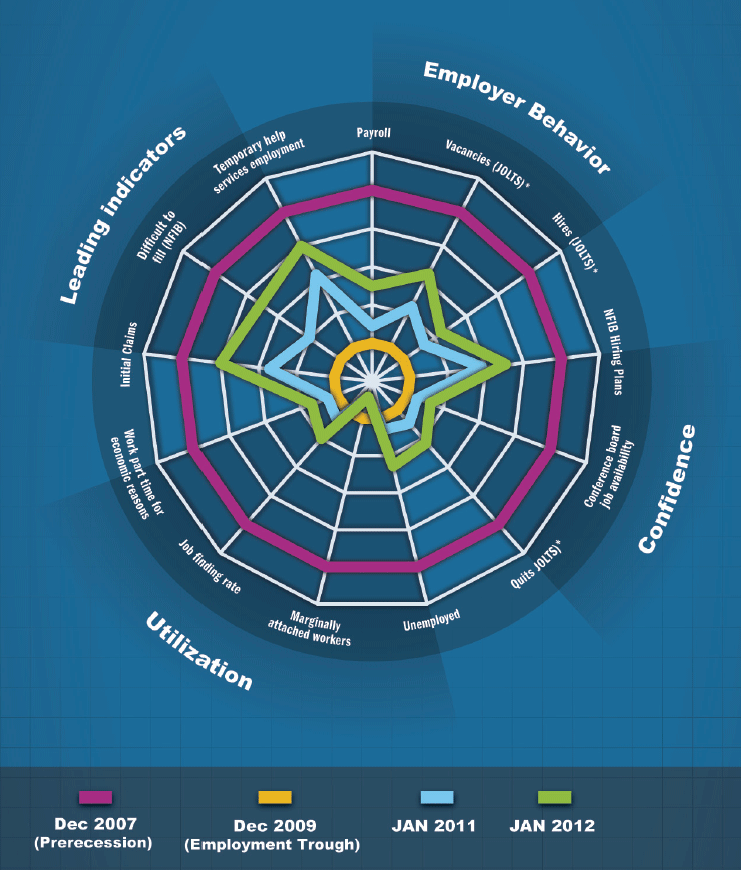
My staff has developed a graphical tool to track labor market developments over recent years. I normally do not use slides in my talks, but I think the picture I'm about to show you helps illuminate the challenge of determining "substantial improvement in the outlook for labor markets."
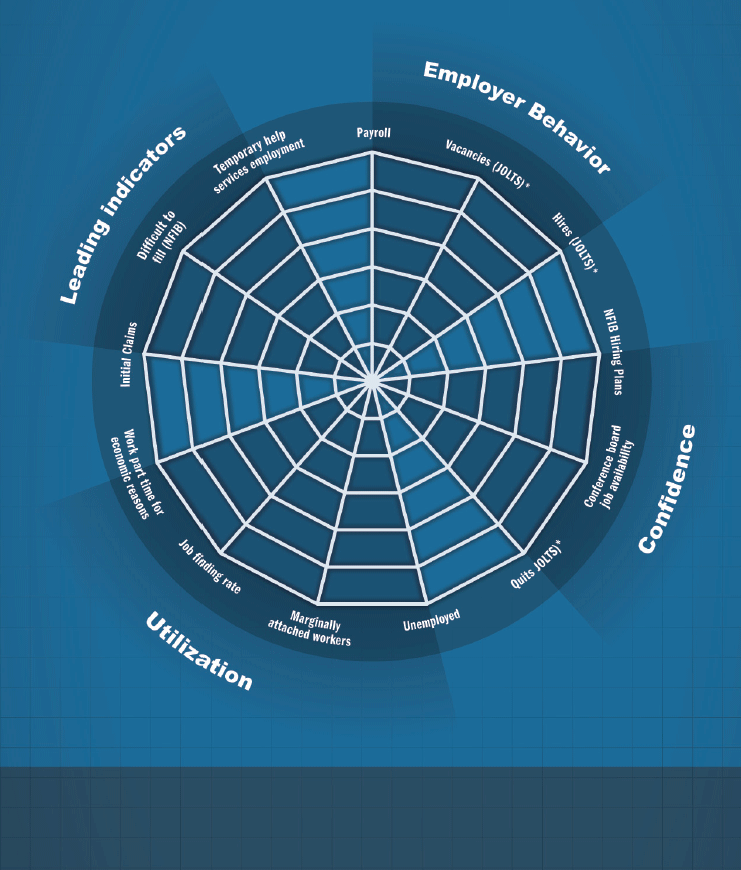
For obvious reasons, this is sometimes called a "spider chart" (probably more accurately a "spiderweb chart").1 Let me walk you through what it shows. We've taken the approach of dividing indicators of labor market conditions into four segments. The segment labeled Employer Behavior includes indicators related to the hiring activities of employers. The segment labeled Confidence includes indicators of employer and worker confidence in the labor market. The segment labeled Utilization includes measures of how available labor resources are being used. And the segment labeled Leading Indicators shows data that typically provide insight into the future direction of overall labor market activity.
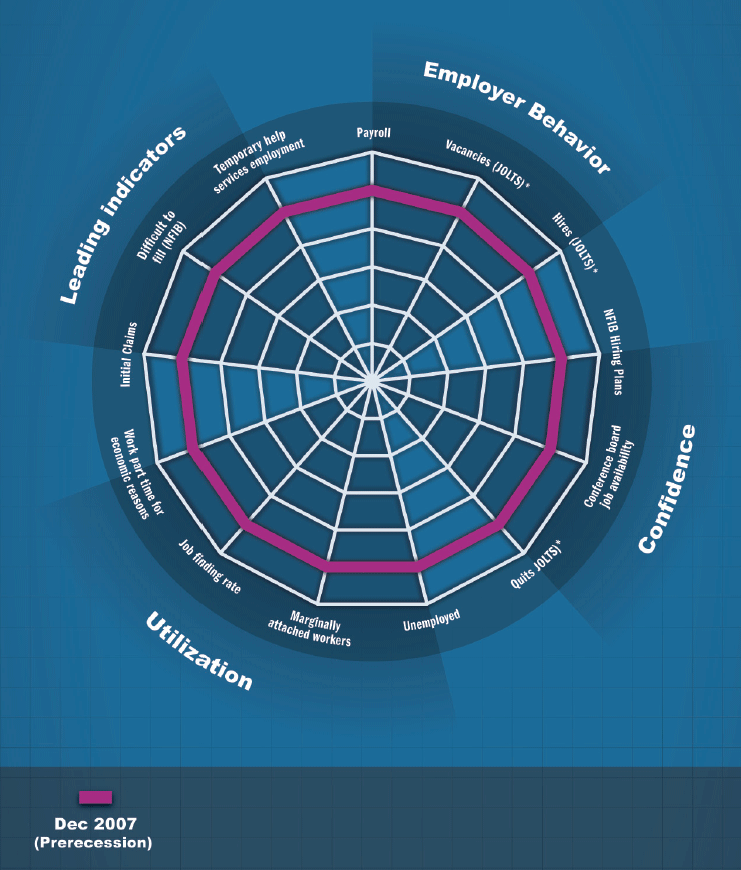
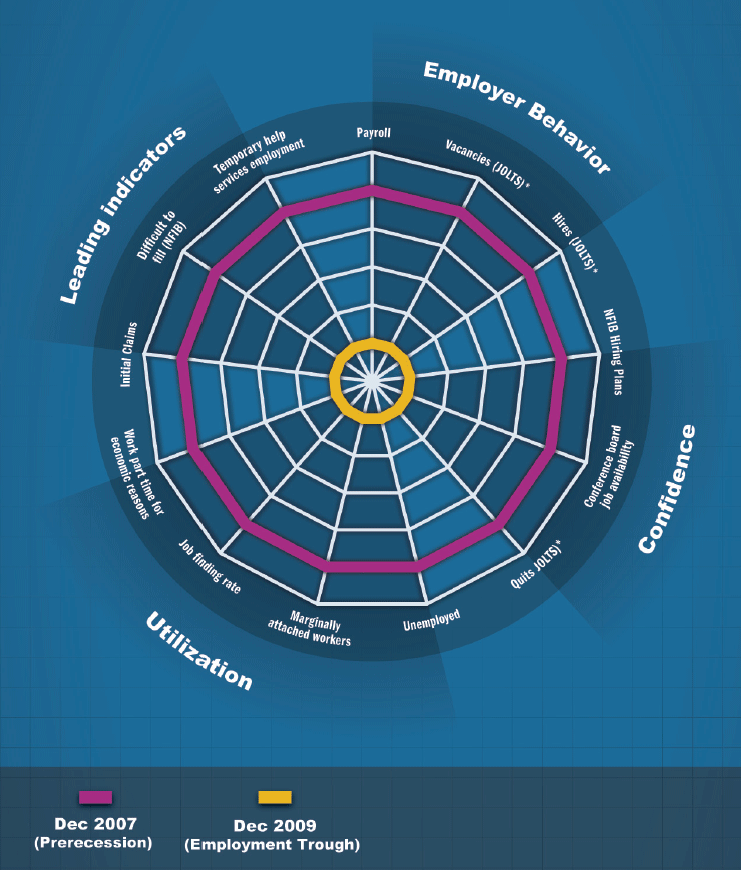
The circle at the perimeter of this chart represents labor market conditions that existed before the recession got under way.2 We have dated this as late 2007. The inner yellow circle represents the state of affairs when payroll employment reached its trough in late 2009.3 You might think of the outer circle as the "boiling point" and the inner circle as the "freezing point," if you like. This oddly shaped light blue figure inside the perimeter4 depicts where each of the indicators was in January 2011 relative to the benchmarks. This green figure5 depicts the state of the labor market in January 2012. And finally, this red figure6 shows where the indicators were as of January 2013.
I should point out that four of the indicators are inverted, meaning that we want them to shrink. These are unemployment, marginally attached, part-time for economic reasons, and initial claims. So for these four indicators, "improving" means declining, but the improvement is still represented by outward movement on the chart.
The progression of these point-in-time snapshots provides us with a picture of how labor market conditions have evolved over the past four years. As you can see, substantial improvement has been achieved in the leading indicator series. As a group, these data points are approaching their pre-recession levels. Employer hiring behavior and confidence are slowly moving outward but remain quite weak relative to the pre-recession benchmarks. Finally, the labor utilization measures are very weak and, notably, have hardly improved at all over the past two years.
Monitoring a set of indicators like these is useful for tracking labor market developments along various dimensions. However, interpreting these developments is complicated by the fact that structural changes in the labor market can influence the evolution of these indicators.
Admittedly, the definition of "structural" is a bit ambiguous. I think a useful working definition is that structural impediments to employment growth are those that cannot be addressed by policies designed mostly to stimulate spending.
The extent of structural labor market impediments is an important factor to consider in any attempt to estimate the efficacy and cost of policy actions. If the structural impediments are large enough, then aggressive policy actions might not be very effective in helping to lower unemployment. Moreover, if structural impediments are large, policy may generate significant economic costs that are not immediately recognized. At the same time, if monetary policy is too timid, cyclical problems may become structural. Chairman Bernanke has commented several times on the risk that the skills of the long-term unemployed may atrophy, making these individuals increasingly unemployable as time passes.
Conclusion
As the minutes of the last two FOMC meetings indicate, policymakers are engaged in discussions of the extent and duration of the quantitative easing program. Considering current labor market conditions, I think continuing the asset purchase program to support the recovery and to improve employment conditions remains appropriate for now. And given the outlook and associated risks, I am comfortable with sticking with the current approach at least into the second half of the year. All things considered, I do not think that monetary policy has yet crossed the line where the benefits of the current policy—specifically the quantitative easing element—are swamped by serious concerns over problems the policy might be creating for the longer term.
The spider charts I presented illustrate that progress across indicators of labor market conditions may be uneven, making the state of overall employment conditions difficult to interpret. For this reason, I think we policymakers should be seeking to carefully balance considerations of longer-term potential costs against the efficacy of policy designed to achieve "substantial improvement."
1Chart 1: Labor market tracking
(enlarge)
2Chart 2: Labor market conditions before the recession
(enlarge)
3Chart 3: Payroll trough in 2009
(enlarge)
4Chart 4: Labor market in January 2011
(enlarge)
5Chart 5: Labor market in January 2012
(enlarge)
6Chart 6: Labor market in January 2013
(enlarge)