June 30, 2016

Asset Quality
Asset quality remains strong, with some concerns about current economic conditions. Although banks still have a large amount of other real estate owned (OREO) on their balance sheets, the aggregate value of the properties has fallen to its lowest level since mid-2008. Nonperforming assets (NPAs) among Sixth District community banks are 1.26 percent, on an aggregate basis, of total loans, a level still on par with precrisis levels (see the chart).
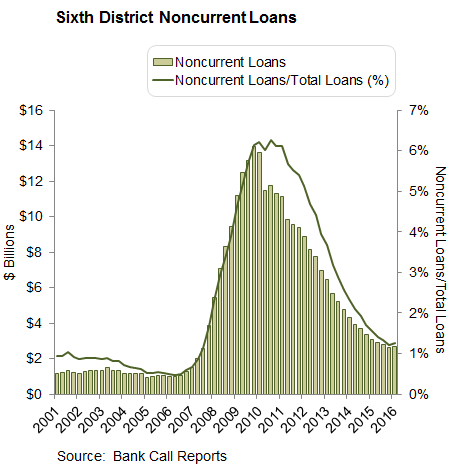
Charge-offs among community banks in District are still at a precrisis low. Asset quality problems are not widespread, being limited for the time being to banks along the Gulf Coast exposed to energy-related credits. Various segments of the oil production industry continue to run at a loss, and rising industry debt burdens makes attracting alternative funding, such as new capital, harder for bank borrowers. Roughly one third of current oil producers could slip into bankruptcy this year according to Fitch, which will put pressure on banks located along the Gulf Coast, especially in Louisiana and Mississippi.
Some issues with energy-related credits were identified in the recent Shared National Credit (SNC) exam. The report noted that significant decreases in oil and gas prices have impaired many energy companies' ability to pay interest and principal and have led to some defaults. According to data from the call report from the first quarter of 2016, banks headquartered in Louisiana and Mississippi experienced a 105 basis point increase, quarter over quarter, in noncurrent commercial and industrial loans, compared with a 77 basis point increase for all other banks in the Sixth District. The year-over-year increase for those banks was 172 basis points. However, most banks in the District are becoming increasingly concerned about potential problems. Some of that concern comes from the length of the current cycle, and some comes from problems being faced by companies based in energy markets. After multiple warnings from regulators about underwriting standards, banks have tightened underwriting standards for multiple portfolios in the first quarter of 2016. Looser underwriting standards tend to lead to asset quality problems when economic conditions shift.
Balance Sheet Growth
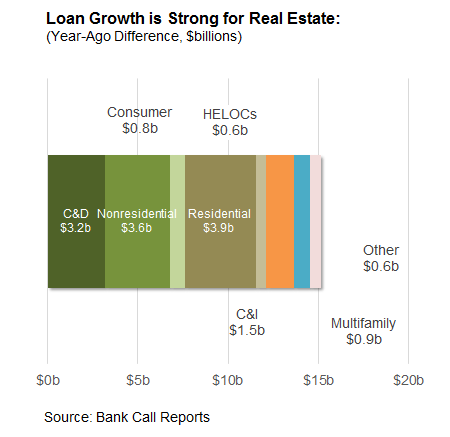
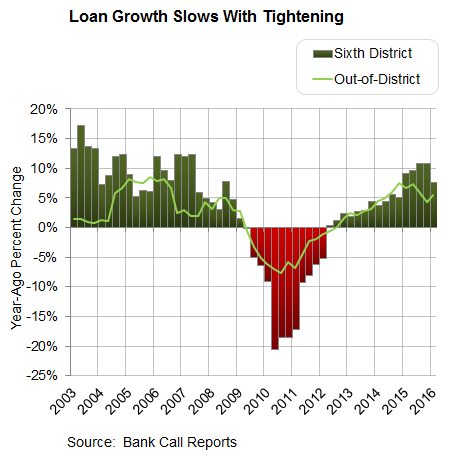
Consistent with banks nationally, loan growth slowed in the first quarter of 2016. Overall loan growth for the quarter was eight percent, the lowest since the fourth quarter of 2014, with banks tightening underwriting and amid lower loan demand. Although significantly lower than the prior quarter, Sixth District institutions are reporting loan growth primarily in real estate, led by residential mortgages, commercial real estate, and construction and development (C&D) (see the chart).
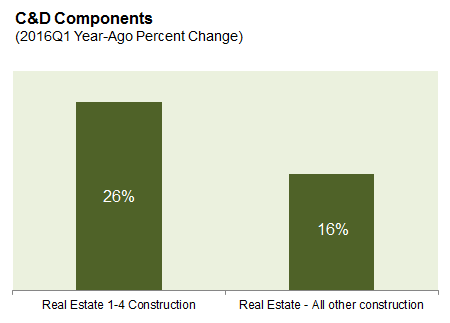
Year-over-year residential construction increased by 26 percent, the third straight quarter that growth has exceeded 20 percent. In the Sixth District, both Atlanta and Central Florida are expected to be hot spots in terms of volume for new home construction, but new housing starts in Atlanta remain at about a third of the number of starts at the peak in 2007. For most of the last five years, new home building has generally been stuck in low gear across many markets in the Sixth District. Part of the reason might be that builders are struggling to find lots in areas where houses are selling in many cities (such as Atlanta and Nashville).
In Atlanta, for example, many of the available lots are south or west of the city. However, demand for houses is still primarily within the city center, where lots are scarce. Given the lack of available lots and new demand, banks may now be willing to fund construction farther out from city centers. The commercial real estate portfolio, in aggregate, grew by $3.6 billion year over year. Banks have been pulling back from the multifamily portfolio and tightening lending standards over concern that some markets maybe oversupplied (see the chart).
Instead, banks have been focused on other property types, such as office and retail, where the borrowers occupy the property. The increase in commercial real estate lending has led to a concern that the sector might be approaching the mature portion of its market cycle. The marketplace is seeing much more discussion about when the next downturn will occur, and the chatter is beginning to weigh on the sentiment of the sector.
Another source of concern is the slowing commercial and industrial (C&I) loan growth. In the years following the financial crisis, banks focused on growing their C&I portfolio. Since energy prices declined, C&I lending standards have tightened for three consecutive quarters across all banks—not just those in the Sixth District, according to the SLOOS. C&I loan growth at banks with assets below $1 billion has moderated by more than half from 2014 levels, dropping from 12.3 percent growth in the fourth quarter of 2014 to 4.5 percent growth in the first quarter of 2016 (see the chart).
As the Sixth District does not have a large exposure to energy, some of the pullback appears related to concerns about retail. Nationally, commercial bankruptcies have spread from energy companies to all kinds and sizes of business, primarily retail. Year-over-year commercial bankruptcy filings have increased more than 30 percent. The consumer loan portfolio remains a low priority for many community banks, although growth reached nearly eight percent, year-over-year in the first quarter of 2016. Banks have been primarily focused on auto lending in the Sixth District. In general, auto loans on banks' balance sheets have grown by 30 percent. Auto lending slowed in the first quarter to 6 percent, its slowest growth in two years.
Capital
The median common tier 1 capital ratio was once again just over 15 percent at community banks in the Sixth District. The growth in capital was slightly higher than the growth in risk-weighted assets, pushing the ratio slightly higher than the previous quarter (see the chart).
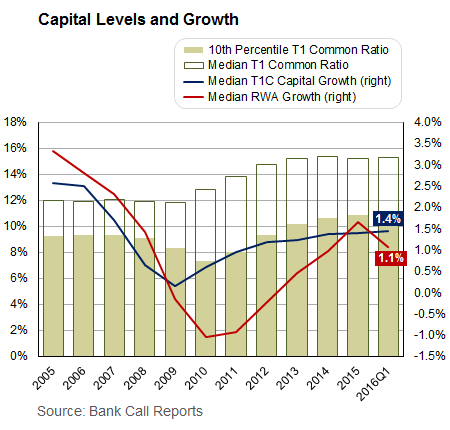
Net income is still a primary driver of capital growth. All banks began phasing in an additional tier 1 common equity capital requirement, the capital conservation buffer, in the first quarter. The buffer is measured relative to risk-weighted assets. For 2016, the buffer is 0.625 percent and will gradually be increased to 2.5 percent during the next three years. Most banks are well within the minimum capital requirements, so the direct impact of the higher capital requirements was minimal.
Earnings Performance
Median ROAA for the quarter was 0.84, a slight decline from the prior quarter, but a 4 basis point improvement over the prior year (see the chart).
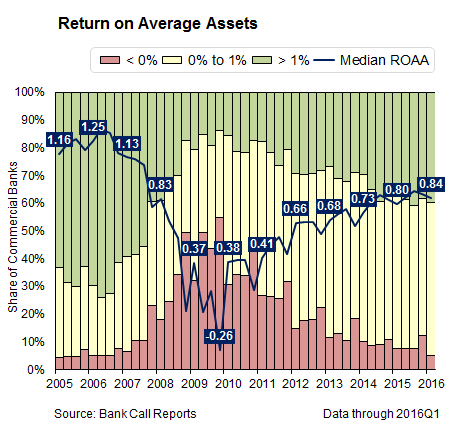
Only 5 percent of the community banks in the Sixth District had negative earnings, the lowest level in almost nine years. Earnings were driven by an improvement in interest income. On a median basis, net interest margin was 3.83 percent. An increase in volume of loans was a primary reason for the 8 basis point year-over-year improvement. Though the margin improved on a year-over-year basis, the margin declined compared with the prior in quarter. The change in rates had a short-term negative impact on the margin as interest expense increased during the quarter. For the first time in more than a year, more banks had a declining net interest margin for the quarter than had higher margins. The aggregate level of provision continued to decline, and the coverage ratio remains roughly 100 percent (see the chart).
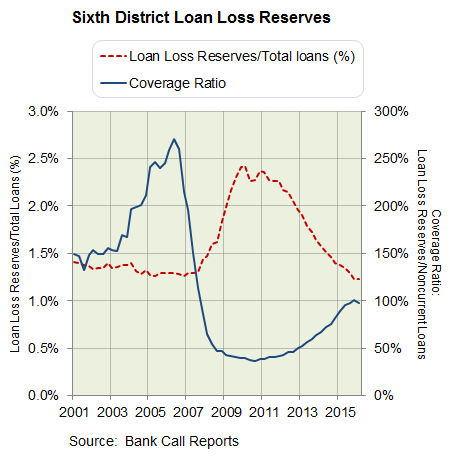
Some Sixth District community banks headquartered along the Gulf Coast with exposure to energy markets are increasing their provisions, but the level of increases is not significant enough to increase provision expense in aggregate across the District. Loan charge-offs were lower during the quarter, which helped reduce the provision. Noninterest income remained flat during the quarter. Community banks continued to struggle in finding ways to improve other fee income, and new regulations may have reduced the level of mortgage income that would have been recorded during the quarter.
After five years of cost-cutting that had significantly reduced noninterest expenses, expenses have started increasing. It's difficult to separate costs to determine if the increase in noninterest expense is the result of costs related to new regulations from other factors that affect community banks' cost structures. A number of organizations, including the Federal Reserve Banks of Minneapolis and Philadelphia, are trying to quantify the costs related to the Dodd-Frank Act to better understand its impact on community banks.
Liquidity
Community banks in the Sixth District have maintained a high level of liquidity. Core deposits continue to grow slowly, reliance on noncore funding remains low, and the securities portfolio is stable, with most banks reporting gains. Noncore funding has remained far below the heights reached during the financial crisis even with the recent spike in loan growth during late 2015 (see the chart).
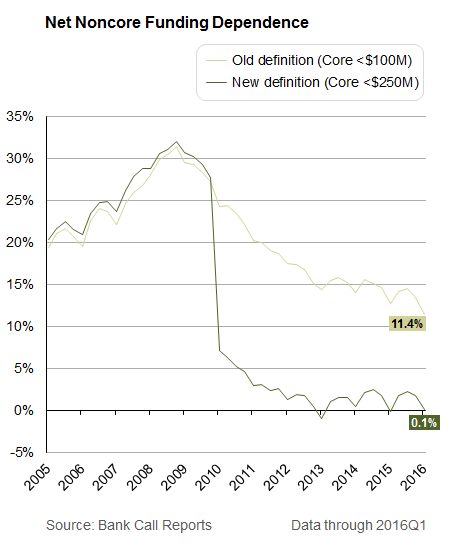
In the first quarter of 2016, the core deposits-to-loans ratio among community banks in the Sixth District is 68 percent, on par with out-of-district banks. The liquidity coverage ratio (LCR) is a still relatively new regulation that is affecting liquidity in the market on a broad basis. Generally, the LCR is calculated as the ratio of high-quality liquid assets (HQLA) to expected net cash outflows during a 30-day period. It appears that the LCR favors retail checking accounts with less than $250,000 in balances with multiple relationships and is viewed as penalizing nonoperating commercial deposits and public/municipal deposits.
Community banks are not directly affected by the ratio. However, it presents a number of challenges and opportunities. There has been discussion surrounding community banks' ability to add new commercial and public/municipal fund deposits. On the downside, the LCR may indirectly affect community banks in their securities portfolio if the communities in which they reside are less able to raise financing because their offerings do not qualify under the rule and are consequently less attractive to investors.
For more detailed information on banking trends in the Sixth District, see the Federal Reserve Bank of Atlanta's Regional Economics Information Network web page. The Federal Reserve Bank of Atlanta also produces a variety of publications dealing with other economic and financial topics. These materials appeal to a wide range of readers, including bankers, businesspeople, economists, students, and economics teachers.
National Banking Trends
At the beginning of each year since 2014, some dips in loan growth at community banks have taken place (see the chart).
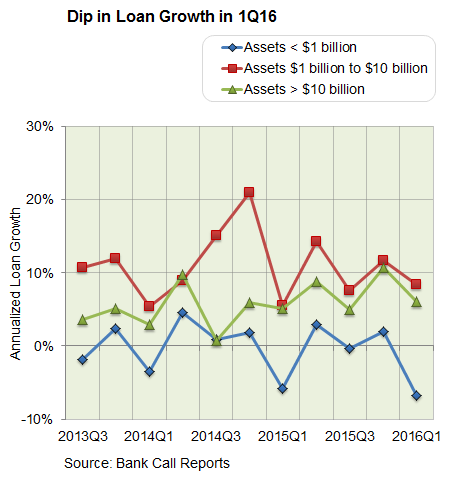
Although in the past the dips may have been tied to an overall slowdown in the economy, the slowdown in the first quarter of 2016 appears deliberate. Loan growth has especially slowed in energy markets, with provisions increasing, but other markets are experiencing slower loan growth as a result of a variety of reasons, including slowing exports and manufacturing. Banks report that they have started tightening lending standards in the face of concerns about commercial and industrial loans (C&I) and commercial real estate (CRE). Some banks are also tightening standards for construction and land development loans.
The drop in energy prices—beyond just the direct exposure to energy production—is also a cause for concern insofar as its impact on local economies. Banks indicated in a Senior Loan Officer Opinion Survey that a spillover from the energy sector on to the credit quality of loans made to households located in energy-sector-dependent regions remains a concern. To date, noncurrent loans have not increased significantly. A small uptick in noncurrent loans, compared with total loans, occurred in the first quarter 2016, and that was the first increase in more than four years. For small community banks (those with less than $1 billion in total assets), the ratio increased to 1.11 percent, compared with 1.09 percent in the prior quarter. The ratio remains extremely low and far below the level from two years ago. Net charge-offs, as a percentage of average loans, also continued to decline.
Although loan growth slowed, earnings remained flat compared with the first quarter of 2015, down slightly from the prior quarter (see the chart).
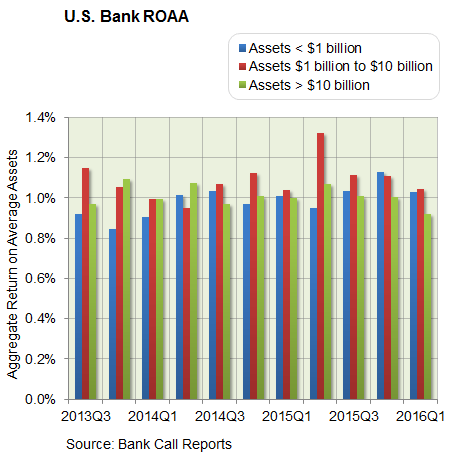
The increase in interest rates in December did not have a significant impact on the net interest margin. Still, the margin has stabilized during the past year, fluctuating quarter-to-quarter by 2 or 3 basis points. Provision expense is increasing in energy markets but remains low across the majority of community banks, reflecting the low levels of nonaccrual loans and charge-offs. However, noninterest income as a percentage of total revenue has gradually declined during the past three quarters. Also, the efficiency ratio—a measure of overhead—has increased as banks have little room for additional cost cutting. Banks point to new regulations, such as TILA-RESPA Integrated Disclosures (TRID), as a reason for the decline in income and increase in noninterest expenses.


